As an options trader, you know the importance of Implied Volatility as a way to estimate options prices.
You want to sell options at high IV, and buy options at low IV to make vega work in your favour.
So you might be interested in the two metrics that show the relative IV positions of an underlying, IV Rank and IV Percentile, and the differences between the two, so you can make educated guesses of the direction of IV as it reverts to the mean.
Contents
What Is IV Rank?
IV Rank uses the highest and lowest IV values of the past year to indicate the relative volatility level of the underlying right now.
What Is IV Percentile?
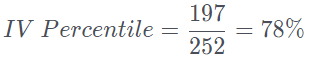
IV Percentile is the percentage of days that the underlying’s Implied Volatility has traded below the current level over the past year.

You might be curious why we use 252 days instead of 365 days in a year. If we remove all the weekends and bank holidays, we have around 252 days in a year that the markets are actually open.
Differences Between IV Rank and IV Percentile
We can use AMZN's IV to describe the difference between IV Rank and IV Percentile.
| 52 week IV high | 52 week IV low | IV | Number of days with lower IVs in the past year |
|---|---|---|---|
| 48% | 21% | 32% | 197 days |
So AMZN’s IV Rank is at 41%, meaning it is around half of the range of IV fluctuations in the past year, and it is unknown whether IV will go up or down next.
While AMZN’s IV Percentile is 78%, meaning it is at a high IV state, so there is a high probability that IV will go down as it reverts to the mean.
As you can see IV Rank and IV Percentile can sometimes give completely different results.
This is because while IV Percentile takes into account all trading days in the past year, IV Rank only uses two extreme IV values as input. So IV Rank can be skewed by outlying IV values, distorting our perception of the relative IV.
Therefore when trading options for vega in neutral options strategies like Iron Condor, we prefer to use IV Percentile to help us understand the relative position of Implied Volatility, and reduce the risk of losing Iron Condors.
Luckily we can use the IV Perc filter in the Options Scanner to find high IV opportunities to sell high probability and high return Strangles and Iron Condors.

Stocks With the Highest IV Percentile
| Symbol | IV | IV Perc | IV Rank | Total Options Volume | Call Options Volume | Put Options Volume | Open Interest | Days To/Since Earnings | Earnings Date | ||
|---|---|---|---|---|---|---|---|---|---|---|---|
| AA | 67% | 69% | 50% | 12,470 | 7,361 | 5,109 | 130,233 | 5 | 2026-07-16 | 2026-09-18 | 2026-07-11 |
| AAL | 47% | 27% | 3% | 60,756 | 35,604 | 25,152 | 1,293,793 | 5 | 2026-07-16 | 2026-09-18 | 2026-07-11 |
| AAOI | 125% | 46% | 31% | 44,651 | 23,776 | 20,875 | 182,383 | 19 | 2026-07-30 | 2026-09-18 | 2026-07-11 |
| AAP | 66% | 54% | 26% | 21,707 | 21,102 | 605 | 74,935 | 45 | 2026-08-25 | 2026-09-18 | 2026-07-11 |
| AAPL | 25% | 49% | 1% | 1,347,610 | 903,002 | 444,608 | 4,042,561 | 19 | 2026-07-30 | 2026-09-18 | 2026-07-11 |
| ABBV | 28% | 50% | 9% | 22,657 | 17,729 | 4,928 | 168,291 | 20 | 2026-07-31 | 2026-09-18 | 2026-07-11 |
| ABNB | 36% | 38% | 25% | 7,197 | 3,950 | 3,247 | 104,081 | 32 | 2026-08-12 | 2026-09-18 | 2026-07-11 |
| ABT | 37% | 93% | 1% | 7,158 | 4,542 | 2,616 | 116,525 | 5 | 2026-07-16 | 2026-09-18 | 2026-07-11 |
| ABVX | 55% | 7% | 99% | 9,783 | 4,927 | 4,856 | 89,205 | 72 | 2026-09-21 | 2026-09-18 | 2026-07-11 |
| ACN | 45% | 60% | 2% | 10,348 | 4,752 | 5,596 | 136,022 | 82 | 2026-10-01 | 2026-09-18 | 2026-07-11 |
| ADBE | 40% | 51% | 30% | 51,370 | 35,274 | 16,096 | 383,444 | 61 | 2026-09-10 | 2026-09-18 | 2026-07-11 |
| ADEA | 110% | 59% | 99% | 275 | 232 | 43 | 24,918 | 31 | 2026-08-11 | 2026-09-18 | 2026-07-11 |
| ADI | 59% | 94% | 77% | 15,025 | 6,654 | 8,371 | 34,920 | 46 | 2026-08-26 | 2026-09-18 | 2026-07-11 |
| ADM | 41% | 77% | 98% | 1,867 | 944 | 923 | 34,557 | 17 | 2026-07-28 | 2026-09-18 | 2026-07-11 |
| AEHR | 175% | 86% | 59% | 4,494 | 2,984 | 1,510 | 32,648 | 3 | 2026-07-14 | 2026-09-18 | 2026-07-11 |
| AEM | 45% | 47% | 32% | 5,178 | 3,174 | 2,004 | 26,304 | 18 | 2026-07-29 | 2026-09-18 | 2026-07-11 |
| AEVA | 123% | 26% | 98% | 835 | 510 | 325 | 25,914 | 32 | 2026-08-12 | 2026-09-18 | 2026-07-11 |
| AFRM | 54% | 7% | 12% | 18,122 | 12,495 | 5,627 | 110,513 | 40 | 2026-08-20 | 2026-09-18 | 2026-07-11 |
| AGI | 59% | 74% | 0% | 3,045 | 2,679 | 366 | 35,991 | 18 | 2026-07-29 | 2026-09-18 | 2026-07-11 |
| AGNC | 36% | 67% | 23% | 7,890 | 6,072 | 1,818 | 339,632 | 9 | 2026-07-20 | 2026-09-18 | 2026-07-11 |
| AKAM | 70% | 82% | 0% | 3,102 | 1,744 | 1,358 | 60,436 | 26 | 2026-08-06 | 2026-09-18 | 2026-07-11 |
| ALAB | 117% | 88% | 70% | 30,578 | 18,470 | 12,108 | 88,645 | 24 | 2026-08-04 | 2026-09-18 | 2026-07-11 |
| ALB | 64% | 50% | 41% | 4,402 | 2,283 | 2,119 | 49,430 | 25 | 2026-08-05 | 2026-09-18 | 2026-07-11 |
| ALK | 64% | 59% | 3% | 13,906 | 12,902 | 1,004 | 80,788 | 5 | 2026-07-16 | 2026-09-18 | 2026-07-11 |
| AMAT | 88% | 96% | 0% | 55,847 | 28,945 | 26,902 | 266,874 | 33 | 2026-08-13 | 2026-09-18 | 2026-07-11 |
| AMD | 71% | 79% | 91% | 491,380 | 285,838 | 205,542 | 1,868,790 | 24 | 2026-08-04 | 2026-09-18 | 2026-07-11 |
| AMGN | 27% | 43% | 30% | 4,938 | 2,693 | 2,245 | 41,042 | 24 | 2026-08-04 | 2026-09-18 | 2026-07-11 |
| AMKR | 118% | 95% | 42% | 3,888 | 2,330 | 1,558 | 81,228 | 16 | 2026-07-27 | 2026-09-18 | 2026-07-11 |
| AMPX | 105% | 36% | 97% | 6,253 | 3,075 | 3,178 | 183,841 | 26 | 2026-08-06 | 2026-09-18 | 2026-07-11 |
| AMZN | 37% | 74% | 32% | 814,532 | 604,077 | 210,455 | 3,865,200 | 19 | 2026-07-30 | 2026-09-18 | 2026-07-11 |
| ANET | 64% | 76% | 46% | 33,975 | 23,132 | 10,843 | 237,189 | 24 | 2026-08-04 | 2026-09-18 | 2026-07-11 |
| APA | 45% | 28% | 2% | 4,429 | 2,469 | 1,960 | 47,408 | 26 | 2026-08-06 | 2026-09-18 | 2026-07-11 |
| APH | 39% | 26% | 2% | 3,643 | 1,709 | 1,934 | 71,096 | 18 | 2026-07-29 | 2026-09-18 | 2026-07-11 |
| APLD | 102% | 29% | 33% | 81,941 | 47,669 | 34,272 | 504,175 | 40 | 2026-08-20 | 2026-09-18 | 2026-07-11 |
| APO | 43% | 48% | 35% | 3,551 | 1,438 | 2,113 | 32,292 | 24 | 2026-08-04 | 2026-09-18 | 2026-07-11 |
| APP | 72% | 48% | 31% | 19,960 | 12,544 | 7,416 | 95,697 | 25 | 2026-08-05 | 2026-09-18 | 2026-07-11 |
| APPS | 101% | 14% | 37% | 1,086 | 919 | 167 | 41,390 | 32 | 2026-08-12 | 2026-09-18 | 2026-07-11 |
| AR | 40% | 24% | 18% | 45,647 | 18,646 | 27,001 | 128,334 | 18 | 2026-07-29 | 2026-09-18 | 2026-07-11 |
| ARCC | 31% | 47% | 48% | 3,032 | 2,302 | 730 | 86,330 | 18 | 2026-07-29 | 2026-09-18 | 2026-07-11 |
| ARM | 102% | 90% | 69% | 96,722 | 69,769 | 26,953 | 322,197 | 18 | 2026-07-29 | 2026-09-18 | 2026-07-11 |
| AS | 20% | 3% | 25% | 1,858 | 1,209 | 649 | 25,903 | 45 | 2026-08-25 | 2026-09-18 | 2026-07-11 |
| ASML | 68% | 97% | 75% | 16,888 | 8,217 | 8,671 | 72,620 | 4 | 2026-07-15 | 2026-09-18 | 2026-07-11 |
| ASST | 139% | 88% | 93% | 16,803 | 7,906 | 8,897 | 211,834 | 53 | 2026-09-02 | 2026-09-18 | 2026-07-11 |
| ASTS | 93% | 15% | 28% | 131,283 | 73,463 | 57,820 | 931,938 | 37 | 2026-08-17 | 2026-09-18 | 2026-07-11 |
| ASX | 110% | 76% | 89% | 2,889 | 2,027 | 862 | 73,860 | 12 | 2026-07-23 | 2026-09-18 | 2026-07-11 |
| AVAV | 65% | 29% | 98% | 10,119 | 6,209 | 3,910 | 44,009 | 60 | 2026-09-09 | 2026-09-18 | 2026-07-11 |
| AVGO | 42% | 29% | 18% | 251,127 | 155,771 | 95,356 | 1,511,782 | 54 | 2026-09-03 | 2026-09-18 | 2026-07-11 |
| AXP | 37% | 84% | 60% | 12,654 | 3,628 | 9,026 | 154,379 | 13 | 2026-07-24 | 2026-09-18 | 2026-07-11 |
| AXTI | 158% | 40% | 0% | 21,033 | 9,741 | 11,292 | 138,485 | 19 | 2026-07-30 | 2026-09-18 | 2026-07-11 |
| B | 44% | 34% | 37% | 12,625 | 9,239 | 3,386 | 298,908 | 30 | 2026-08-10 | 2026-09-18 | 2026-07-11 |
| BA | 32% | 44% | 59% | 50,804 | 35,784 | 15,020 | 543,061 | 17 | 2026-07-28 | 2026-09-18 | 2026-07-11 |
| BABA | 46% | 61% | 46% | 263,906 | 207,918 | 55,988 | 1,797,480 | 48 | 2026-08-28 | 2026-09-18 | 2026-07-11 |
| BAC | 26% | 45% | 2% | 110,619 | 50,475 | 60,144 | 1,427,940 | 3 | 2026-07-14 | 2026-09-18 | 2026-07-11 |
| BAX | 52% | 53% | 32% | 2,653 | 1,980 | 673 | 31,591 | 12 | 2026-07-23 | 2026-09-18 | 2026-07-11 |
| BB | 70% | 0% | 0% | 42,841 | 34,797 | 8,044 | 594,012 | 75 | 2026-09-24 | 2026-09-18 | 2026-07-11 |
| BBY | 32% | 10% | 100% | 14,663 | 11,129 | 3,534 | 41,485 | 52 | 2026-09-01 | 2026-09-18 | 2026-07-11 |
| BCRX | 247% | 71% | 82% | 3,227 | 3,099 | 128 | 50,221 | 19 | 2026-07-30 | 2026-09-18 | 2026-07-11 |
| BE | 140% | 88% | 63% | 189,002 | 78,929 | 110,073 | 816,381 | 17 | 2026-07-28 | 2026-09-18 | 2026-07-11 |
| BHP | 35% | 39% | 15% | 1,579 | 1,276 | 303 | 24,636 | 37 | 2026-08-17 | 2026-09-18 | 2026-07-11 |
| BIDU | 57% | 73% | 51% | 19,528 | 9,380 | 10,148 | 152,539 | 46 | 2026-08-26 | 2026-09-18 | 2026-07-11 |
| BILL | 87% | 66% | 51% | 5,104 | 3,673 | 1,431 | 32,565 | 40 | 2026-08-20 | 2026-09-18 | 2026-07-11 |
| BKNG | 38% | 57% | 32% | 10,464 | 6,637 | 3,827 | 162,500 | 24 | 2026-08-04 | 2026-09-18 | 2026-07-11 |
| BKR | 78% | 94% | 98% | 2,451 | 1,213 | 1,238 | 32,429 | 15 | 2026-07-26 | 2026-09-18 | 2026-07-11 |
| BMY | 29% | 33% | 29% | 12,850 | 8,006 | 4,844 | 382,750 | 19 | 2026-07-30 | 2026-09-18 | 2026-07-11 |
| BP | 33% | 63% | 10% | 7,072 | 4,777 | 2,295 | 247,303 | 24 | 2026-08-04 | 2026-09-18 | 2026-07-11 |
| BRK-B | 14% | 22% | 32% | 19,268 | 11,413 | 7,855 | 304,496 | 2026-09-18 | 2026-07-11 | ||
| BSX | 47% | 91% | 56% | 25,813 | 7,732 | 18,081 | 514,103 | 18 | 2026-07-29 | 2026-09-18 | 2026-07-11 |
| BTDR | 157% | 88% | 2% | 48,560 | 44,421 | 4,139 | 293,010 | 27 | 2026-08-07 | 2026-09-18 | 2026-07-11 |
| BTI | 63% | 81% | 92% | 1,363 | 691 | 672 | 37,865 | 19 | 2026-07-30 | 2026-09-18 | 2026-07-11 |
| BX | 44% | 67% | 94% | 8,433 | 5,268 | 3,165 | 203,127 | 12 | 2026-07-23 | 2026-09-18 | 2026-07-11 |
| C | 35% | 70% | 0% | 53,240 | 27,068 | 26,172 | 538,178 | 3 | 2026-07-14 | 2026-09-18 | 2026-07-11 |
| CAG | 46% | 85% | 46% | 5,355 | 4,076 | 1,279 | 135,145 | 4 | 2026-07-15 | 2026-09-18 | 2026-07-11 |
| CAPR | 117% | 74% | 1% | 1,600 | 1,046 | 554 | 39,251 | 32 | 2026-08-12 | 2026-09-18 | 2026-07-11 |
| CAR | 70% | 64% | 10% | 2,740 | 1,113 | 1,627 | 31,980 | 24 | 2026-08-04 | 2026-09-18 | 2026-07-11 |
| CART | 51% | 49% | 19% | 8,784 | 1,444 | 7,340 | 53,495 | 32 | 2026-08-12 | 2026-09-18 | 2026-07-11 |
| CAT | 48% | 94% | 74% | 43,510 | 27,186 | 16,324 | 138,464 | 24 | 2026-08-04 | 2026-09-18 | 2026-07-11 |
| CAVA | 53% | 27% | 17% | 6,090 | 4,232 | 1,858 | 70,397 | 38 | 2026-08-18 | 2026-09-18 | 2026-07-11 |
| CCJ | 48% | 22% | 17% | 15,680 | 10,032 | 5,648 | 230,685 | 20 | 2026-07-31 | 2026-09-18 | 2026-07-11 |
| CCL | 40% | 24% | 0% | 22,050 | 12,745 | 9,305 | 648,492 | 68 | 2026-09-17 | 2026-09-18 | 2026-07-11 |
| CDE | 59% | 4% | 3% | 9,551 | 5,870 | 3,681 | 302,772 | 25 | 2026-08-05 | 2026-09-18 | 2026-07-11 |
| CDNS | 53% | 70% | 38% | 2,132 | 871 | 1,261 | 30,886 | 16 | 2026-07-27 | 2026-09-18 | 2026-07-11 |
| CEG | 51% | 40% | 32% | 9,130 | 4,213 | 4,917 | 132,675 | 26 | 2026-08-06 | 2026-09-18 | 2026-07-11 |
| CELH | 65% | 63% | 32% | 16,405 | 10,573 | 5,832 | 317,245 | 31 | 2026-08-11 | 2026-09-18 | 2026-07-11 |
| CF | 56% | 76% | 43% | 2,936 | 1,690 | 1,246 | 29,517 | 25 | 2026-08-05 | 2026-09-18 | 2026-07-11 |
| CG | 45% | 36% | 24% | 918 | 825 | 93 | 244,576 | 25 | 2026-08-05 | 2026-09-18 | 2026-07-11 |
| CGON | 199% | 94% | 69% | 2,923 | 2,142 | 781 | 49,393 | 27 | 2026-08-07 | 2026-09-18 | 2026-07-11 |
| CHTR | 82% | 92% | 61% | 9,505 | 6,270 | 3,235 | 80,128 | 13 | 2026-07-24 | 2026-09-18 | 2026-07-11 |
| CHWY | 46% | 39% | 25% | 11,786 | 5,888 | 5,898 | 141,317 | 53 | 2026-09-02 | 2026-09-18 | 2026-07-11 |
| CHYM | 82% | 30% | 26% | 766 | 585 | 181 | 25,062 | 26 | 2026-08-06 | 2026-09-18 | 2026-07-11 |
| CIFR | 116% | 48% | 32% | 72,133 | 58,364 | 13,769 | 745,876 | 31 | 2026-08-11 | 2026-09-18 | 2026-07-11 |
| CL | 26% | 61% | 100% | 1,848 | 1,140 | 708 | 36,456 | 20 | 2026-07-31 | 2026-09-18 | 2026-07-11 |
| CLS | 80% | 49% | 39% | 5,946 | 2,436 | 3,510 | 38,458 | 16 | 2026-07-27 | 2026-09-18 | 2026-07-11 |
| CLSK | 86% | 19% | 83% | 56,001 | 49,879 | 6,122 | 439,175 | 31 | 2026-08-11 | 2026-09-18 | 2026-07-11 |
| CLX | 42% | 74% | 100% | 6,805 | 4,636 | 2,169 | 65,439 | 25 | 2026-08-05 | 2026-09-18 | 2026-07-11 |
| CMCSA | 42% | 79% | 3% | 26,405 | 20,631 | 5,774 | 650,967 | 12 | 2026-07-23 | 2026-09-18 | 2026-07-11 |
| CMG | 46% | 78% | 3% | 45,222 | 38,921 | 6,301 | 455,183 | 18 | 2026-07-29 | 2026-09-18 | 2026-07-11 |
| CNC | 56% | 62% | 0% | 5,403 | 3,858 | 1,545 | 118,054 | 17 | 2026-07-28 | 2026-09-18 | 2026-07-11 |
| CNQ | 29% | 20% | 99% | 780 | 445 | 335 | 28,201 | 19 | 2026-07-30 | 2026-09-18 | 2026-07-11 |
| COF | 40% | 74% | 71% | 9,117 | 7,172 | 1,945 | 67,605 | 10 | 2026-07-21 | 2026-09-18 | 2026-07-11 |
| COHR | 95% | 66% | 56% | 20,036 | 8,490 | 11,546 | 104,043 | 33 | 2026-08-13 | 2026-09-18 | 2026-07-11 |
| COIN | 70% | 55% | 40% | 202,323 | 140,363 | 61,960 | 711,864 | 19 | 2026-07-30 | 2026-09-18 | 2026-07-11 |
| COP | 33% | 53% | 35% | 11,440 | 8,880 | 2,560 | 167,713 | 26 | 2026-08-06 | 2026-09-18 | 2026-07-11 |
| COPX | 49% | 42% | 97% | 6,417 | 4,497 | 1,920 | 176,927 | 2026-09-18 | 2026-07-11 | ||
| CORZ | 86% | 44% | 1% | 40,825 | 28,056 | 12,769 | 827,840 | 26 | 2026-08-06 | 2026-09-18 | 2026-07-11 |
| COST | 22% | 43% | 30% | 58,586 | 30,715 | 27,871 | 201,863 | 75 | 2026-09-24 | 2026-09-18 | 2026-07-11 |
| CPB | 39% | 64% | 100% | 6,229 | 3,031 | 3,198 | 73,299 | 47 | 2026-08-27 | 2026-09-18 | 2026-07-11 |
| CPNG | 55% | 65% | 100% | 70,061 | 68,222 | 1,839 | 299,873 | 31 | 2026-08-11 | 2026-09-18 | 2026-07-11 |
| CPRT | 82% | 94% | 1% | 3,410 | 1,411 | 1,999 | 33,587 | 60 | 2026-09-09 | 2026-09-18 | 2026-07-11 |
| CRCL | 86% | 43% | 36% | 288,306 | 225,589 | 62,717 | 560,876 | 38 | 2026-08-18 | 2026-09-18 | 2026-07-11 |
| CRDO | 116% | 84% | 57% | 17,295 | 10,056 | 7,239 | 89,486 | 60 | 2026-09-09 | 2026-09-18 | 2026-07-11 |
| CRK | 79% | 72% | 35% | 3,540 | 2,475 | 1,065 | 29,578 | 18 | 2026-07-29 | 2026-09-18 | 2026-07-11 |
| CRM | 42% | 47% | 96% | 48,111 | 31,282 | 16,829 | 648,393 | 53 | 2026-09-02 | 2026-09-18 | 2026-07-11 |
| CRSP | 82% | 90% | 64% | 5,934 | 4,636 | 1,298 | 33,621 | 30 | 2026-08-10 | 2026-09-18 | 2026-07-11 |
| CRWD | 58% | 82% | 44% | 83,312 | 43,874 | 39,438 | 644,584 | 53 | 2026-09-02 | 2026-09-18 | 2026-07-11 |
| CRWV | 83% | 15% | 18% | 181,913 | 104,933 | 76,980 | 1,333,899 | 38 | 2026-08-18 | 2026-09-18 | 2026-07-11 |
| CSCO | 44% | 92% | 97% | 70,493 | 47,731 | 22,762 | 582,499 | 39 | 2026-08-19 | 2026-09-18 | 2026-07-11 |
| CSIQ | 113% | 76% | 74% | 1,773 | 873 | 900 | 44,789 | 40 | 2026-08-20 | 2026-09-18 | 2026-07-11 |
| CSX | 28% | 41% | 15% | 48,433 | 47,152 | 1,281 | 95,731 | 11 | 2026-07-22 | 2026-09-18 | 2026-07-11 |
| CTSH | 85% | 97% | 4% | 1,868 | 1,088 | 780 | 60,514 | 18 | 2026-07-29 | 2026-09-18 | 2026-07-11 |
| CVE | 42% | 42% | 56% | 7,649 | 5,646 | 2,003 | 24,975 | 12 | 2026-07-23 | 2026-09-18 | 2026-07-11 |
| CVNA | 78% | 71% | 36% | 56,035 | 35,607 | 20,428 | 541,359 | 18 | 2026-07-29 | 2026-09-18 | 2026-07-11 |
| CVS | 36% | 68% | 32% | 15,648 | 11,004 | 4,644 | 162,584 | 25 | 2026-08-05 | 2026-09-18 | 2026-07-11 |
| CVX | 29% | 55% | 30% | 47,474 | 40,671 | 6,803 | 358,107 | 20 | 2026-07-31 | 2026-09-18 | 2026-07-11 |
| CXW | 82% | 89% | 38% | 4,203 | 3,652 | 551 | 43,718 | 25 | 2026-08-05 | 2026-09-18 | 2026-07-11 |
| CYTK | 31% | 2% | 95% | 3,006 | 1,933 | 1,073 | 33,189 | 19 | 2026-07-30 | 2026-09-18 | 2026-07-11 |
| CZR | 23% | 5% | 0% | 5,093 | 4,954 | 139 | 150,675 | 17 | 2026-07-28 | 2026-09-18 | 2026-07-11 |
| DAL | 40% | 20% | 100% | 60,701 | 29,232 | 31,469 | 307,997 | 89 | 2026-10-08 | 2026-09-18 | 2026-07-11 |
| DASH | 54% | 53% | 29% | 4,215 | 2,915 | 1,300 | 68,896 | 25 | 2026-08-05 | 2026-09-18 | 2026-07-11 |
| DDOG | 69% | 76% | 43% | 15,494 | 8,228 | 7,266 | 103,728 | 26 | 2026-08-06 | 2026-09-18 | 2026-07-11 |
| DELL | 77% | 86% | 56% | 67,852 | 37,349 | 30,503 | 309,208 | 54 | 2026-09-03 | 2026-09-18 | 2026-07-11 |
| DG | 39% | 54% | 28% | 5,036 | 2,510 | 2,526 | 33,620 | 47 | 2026-08-27 | 2026-09-18 | 2026-07-11 |
| DHR | 38% | 68% | 0% | 3,633 | 2,790 | 843 | 31,585 | 10 | 2026-07-21 | 2026-09-18 | 2026-07-11 |
| DHT | 60% | 65% | 0% | 1,546 | 1,392 | 154 | 59,891 | 32 | 2026-08-12 | 2026-09-18 | 2026-07-11 |
| DIA | 11% | 4% | 10% | 48,679 | 22,399 | 26,280 | 227,857 | 2026-09-18 | 2026-07-11 | ||
| DINO | 50% | 63% | 0% | 3,956 | 3,609 | 347 | 63,587 | 17 | 2026-07-28 | 2026-09-18 | 2026-07-11 |
| DIS | 25% | 30% | 99% | 34,644 | 18,512 | 16,132 | 462,267 | 32 | 2026-08-12 | 2026-09-18 | 2026-07-11 |
| DKNG | 48% | 31% | 0% | 39,029 | 32,425 | 6,604 | 508,550 | 20 | 2026-07-31 | 2026-09-18 | 2026-07-11 |
| DLO | 310% | 99% | 11% | 7,818 | 7,594 | 224 | 157,687 | 33 | 2026-08-13 | 2026-09-18 | 2026-07-11 |
| DLTR | 41% | 41% | 25% | 5,014 | 1,821 | 3,193 | 33,647 | 40 | 2026-08-20 | 2026-09-18 | 2026-07-11 |
| DOCN | 107% | 81% | 10% | 11,142 | 9,055 | 2,087 | 51,817 | 32 | 2026-08-12 | 2026-09-18 | 2026-07-11 |
| DOCU | 58% | 58% | 0% | 6,131 | 4,211 | 1,920 | 42,230 | 54 | 2026-09-03 | 2026-09-18 | 2026-07-11 |
| DOW | 58% | 80% | 54% | 12,114 | 7,024 | 5,090 | 265,147 | 12 | 2026-07-23 | 2026-09-18 | 2026-07-11 |
| DUK | 36% | 84% | 100% | 1,014 | 661 | 353 | 45,238 | 24 | 2026-08-04 | 2026-09-18 | 2026-07-11 |
| DUOL | 68% | 38% | 19% | 4,071 | 2,736 | 1,335 | 24,602 | 25 | 2026-08-05 | 2026-09-18 | 2026-07-11 |
| DVN | 67% | 99% | 100% | 20,042 | 11,438 | 8,604 | 469,708 | 24 | 2026-08-04 | 2026-09-18 | 2026-07-11 |
| EBAY | 38% | 52% | 0% | 2,587 | 2,094 | 493 | 25,820 | 25 | 2026-08-05 | 2026-09-18 | 2026-07-11 |
| ECHO | 56% | 0% | 0% | 8,422 | 6,175 | 2,247 | 260,338 | 19 | 2026-07-30 | 2026-09-18 | 2026-07-11 |
| EEM | 34% | 79% | 0% | 49,547 | 20,617 | 28,930 | 1,896,932 | 2026-09-18 | 2026-07-11 | ||
| EFA | 15% | 39% | 99% | 31,216 | 15,858 | 15,358 | 308,423 | 2026-09-18 | 2026-07-11 | ||
| EL | 45% | 41% | 25% | 2,756 | 2,406 | 350 | 39,992 | 39 | 2026-08-19 | 2026-09-18 | 2026-07-11 |
| ELF | 71% | 56% | 30% | 9,075 | 5,719 | 3,356 | 72,663 | 32 | 2026-08-12 | 2026-09-18 | 2026-07-11 |
| ENPH | 95% | 80% | 55% | 42,263 | 37,459 | 4,804 | 253,612 | 17 | 2026-07-28 | 2026-09-18 | 2026-07-11 |
| EOG | 43% | 91% | 45% | 3,776 | 2,050 | 1,726 | 49,237 | 24 | 2026-08-04 | 2026-09-18 | 2026-07-11 |
| EPD | 22% | 57% | 0% | 2,968 | 1,513 | 1,455 | 79,665 | 19 | 2026-07-30 | 2026-09-18 | 2026-07-11 |
| EQT | 31% | 8% | 100% | 26,881 | 16,235 | 10,646 | 236,243 | 10 | 2026-07-21 | 2026-09-18 | 2026-07-11 |
| ETN | 43% | 69% | 39% | 5,062 | 1,113 | 3,949 | 31,336 | 24 | 2026-08-04 | 2026-09-18 | 2026-07-11 |
| ETSY | 76% | 87% | 20% | 6,716 | 4,976 | 1,740 | 50,775 | 25 | 2026-08-05 | 2026-09-18 | 2026-07-11 |
| EWJ | 24% | 47% | 32% | 1,264 | 981 | 283 | 45,531 | 2026-09-18 | 2026-07-11 | ||
| EWT | 47% | 83% | 3% | 1,308 | 486 | 822 | 17,652 | 2026-09-18 | 2026-07-11 | ||
| EWW | 32% | 71% | 22% | 34 | 6 | 28 | 178 | 2026-09-18 | 2026-07-11 | ||
| EWZ | 26% | 22% | 9% | 491,894 | 350,450 | 141,444 | 3,037,392 | 2026-09-18 | 2026-07-11 | ||
| EXE | 64% | 94% | 20% | 5,266 | 3,987 | 1,279 | 170,569 | 24 | 2026-08-04 | 2026-09-18 | 2026-07-11 |
| F | 55% | 94% | 0% | 110,929 | 79,342 | 31,587 | 1,489,506 | 17 | 2026-07-28 | 2026-09-18 | 2026-07-11 |
| FAST | 46% | 81% | 61% | 2,574 | 1,898 | 676 | 34,998 | 2 | 2026-07-13 | 2026-09-18 | 2026-07-11 |
| FCEL | 151% | 24% | 23% | 22,310 | 16,172 | 6,138 | 136,438 | 59 | 2026-09-08 | 2026-09-18 | 2026-07-11 |
| FCX | 58% | 84% | 72% | 33,312 | 15,112 | 18,200 | 849,484 | 12 | 2026-07-23 | 2026-09-18 | 2026-07-11 |
| FIG | 84% | 42% | 100% | 41,140 | 28,729 | 12,411 | 363,133 | 60 | 2026-09-09 | 2026-09-18 | 2026-07-11 |
| FISV | 50% | 49% | 100% | 9,753 | 5,654 | 4,099 | 177,021 | 18 | 2026-07-29 | 2026-09-18 | 2026-07-11 |
| FLEX | 91% | 92% | 45% | 2,833 | 2,057 | 776 | 32,525 | 18 | 2026-07-29 | 2026-09-18 | 2026-07-11 |
| FLR | 58% | 48% | 37% | 415 | 280 | 135 | 32,829 | 27 | 2026-08-07 | 2026-09-18 | 2026-07-11 |
| FLUT | 54% | 56% | 33% | 1,574 | 594 | 980 | 32,116 | 26 | 2026-08-06 | 2026-09-18 | 2026-07-11 |
| FLY | 110% | 30% | 25% | 12,500 | 9,487 | 3,013 | 84,459 | 79 | 2026-09-28 | 2026-09-18 | 2026-07-11 |
| FROG | 66% | 44% | 25% | 1,785 | 1,593 | 192 | 56,139 | 25 | 2026-08-05 | 2026-09-18 | 2026-07-11 |
| FSLR | 71% | 82% | 53% | 10,947 | 7,419 | 3,528 | 178,679 | 12 | 2026-07-23 | 2026-09-18 | 2026-07-11 |
| FSLY | 98% | 61% | 37% | 6,392 | 3,745 | 2,647 | 63,245 | 25 | 2026-08-05 | 2026-09-18 | 2026-07-11 |
| FTNT | 68% | 89% | 69% | 26,642 | 13,071 | 13,571 | 97,402 | 18 | 2026-07-29 | 2026-09-18 | 2026-07-11 |
| FUTU | 63% | 69% | 42% | 6,771 | 1,191 | 5,580 | 39,263 | 46 | 2026-08-26 | 2026-09-18 | 2026-07-11 |
| FXE | 11% | 76% | 66% | 1,176 | 26 | 1,150 | 20,086 | 2026-09-18 | 2026-07-11 | ||
| FXI | 21% | 15% | 0% | 130,547 | 87,979 | 42,568 | 1,224,178 | 2026-09-18 | 2026-07-11 | ||
| GAP | 35% | 2% | 7% | 5,745 | 2,052 | 3,693 | 46,826 | 40 | 2026-08-20 | 2026-09-18 | 2026-07-11 |
| GDS | 99% | 86% | 41% | 922 | 859 | 63 | 35,134 | 46 | 2026-08-26 | 2026-09-18 | 2026-07-11 |
| GDX | 43% | 41% | 39% | 77,063 | 28,028 | 49,035 | 1,103,445 | 2026-09-18 | 2026-07-11 | ||
| GDXJ | 51% | 39% | 27% | 4,472 | 2,157 | 2,315 | 42,174 | 2026-09-18 | 2026-07-11 | ||
| GE | 43% | 83% | 52% | 10,659 | 5,677 | 4,982 | 127,951 | 5 | 2026-07-16 | 2026-09-18 | 2026-07-11 |
| GEO | 54% | 12% | 1% | 2,884 | 2,721 | 163 | 59,183 | 32 | 2026-08-12 | 2026-09-18 | 2026-07-11 |
| GEV | 67% | 96% | 76% | 15,052 | 6,697 | 8,355 | 84,219 | 11 | 2026-07-22 | 2026-09-18 | 2026-07-11 |
| GFL | 62% | 58% | 92% | 377 | 363 | 14 | 28,885 | 18 | 2026-07-29 | 2026-09-18 | 2026-07-11 |
| GILD | 27% | 19% | 17% | 8,595 | 6,792 | 1,803 | 102,997 | 19 | 2026-07-30 | 2026-09-18 | 2026-07-11 |
| GIS | 29% | 22% | 0% | 27,747 | 10,266 | 17,481 | 143,071 | 74 | 2026-09-23 | 2026-09-18 | 2026-07-11 |
| GLD | 21% | 53% | 27% | 200,650 | 115,564 | 85,086 | 2,038,697 | 2026-09-18 | 2026-07-11 | ||
| GLNG | -1999% | 0% | 0% | 231 | 186 | 45 | 55,062 | 33 | 2026-08-13 | 2026-09-18 | 2026-07-11 |
| GLW | 86% | 90% | 14% | 45,712 | 23,176 | 22,536 | 344,681 | 17 | 2026-07-28 | 2026-09-18 | 2026-07-11 |
| GLXY | 108% | 76% | 16% | 16,506 | 14,156 | 2,350 | 226,878 | 31 | 2026-08-11 | 2026-09-18 | 2026-07-11 |
| GM | 39% | 68% | 99% | 16,330 | 11,591 | 4,739 | 203,955 | 10 | 2026-07-21 | 2026-09-18 | 2026-07-11 |
| GME | 30% | 2% | 1% | 100,902 | 80,931 | 19,971 | 1,198,028 | 60 | 2026-09-09 | 2026-09-18 | 2026-07-11 |
| GOOG | 41% | 88% | 46% | 153,932 | 113,374 | 40,558 | 1,114,520 | 11 | 2026-07-22 | 2026-09-18 | 2026-07-11 |
| GOOGL | 33% | 60% | 32% | 420,595 | 296,597 | 123,998 | 1,870,090 | 11 | 2026-07-22 | 2026-09-18 | 2026-07-11 |
| GRPN | 105% | 71% | 100% | 2,325 | 2,060 | 265 | 41,127 | 32 | 2026-08-12 | 2026-09-18 | 2026-07-11 |
| GRRR | 92% | 14% | 2% | 1,569 | 1,174 | 395 | 32,776 | 88 | 2026-10-07 | 2026-09-18 | 2026-07-11 |
| GS | 40% | 89% | 71% | 44,225 | 20,557 | 23,668 | 178,316 | 3 | 2026-07-14 | 2026-09-18 | 2026-07-11 |
| GTLB | 65% | 32% | 18% | 4,523 | 3,682 | 841 | 49,796 | 59 | 2026-09-08 | 2026-09-18 | 2026-07-11 |
| HAL | 39% | 38% | 44% | 13,824 | 10,040 | 3,784 | 213,273 | 10 | 2026-07-21 | 2026-09-18 | 2026-07-11 |
| HD | 27% | 47% | 0% | 20,133 | 15,654 | 4,479 | 149,517 | 38 | 2026-08-18 | 2026-09-18 | 2026-07-11 |
| HIMS | 98% | 75% | 43% | 105,971 | 68,846 | 37,125 | 685,588 | 30 | 2026-08-10 | 2026-09-18 | 2026-07-11 |
| HIMX | 113% | 60% | 46% | 503 | 369 | 134 | 26,925 | 26 | 2026-08-06 | 2026-09-18 | 2026-07-11 |
| HL | 62% | 7% | 17% | 14,019 | 9,566 | 4,453 | 340,331 | 31 | 2026-08-11 | 2026-09-18 | 2026-07-11 |
| HON | 52% | 97% | 81% | 4,483 | 3,580 | 903 | 29,251 | 12 | 2026-07-23 | 2026-09-18 | 2026-07-11 |
| HOOD | 66% | 48% | 35% | 417,248 | 320,357 | 96,891 | 1,439,974 | 18 | 2026-07-29 | 2026-09-18 | 2026-07-11 |
| HPE | 77% | 93% | 89% | 40,681 | 33,082 | 7,599 | 305,499 | 52 | 2026-09-01 | 2026-09-18 | 2026-07-11 |
| HPQ | 43% | 51% | 1% | 15,392 | 5,002 | 10,390 | 234,995 | 52 | 2026-09-01 | 2026-09-18 | 2026-07-11 |
| HRL | 28% | 32% | 99% | 11,190 | 10,843 | 347 | 31,988 | 47 | 2026-08-27 | 2026-09-18 | 2026-07-11 |
| HUT | 124% | 81% | 33% | 29,941 | 14,807 | 15,134 | 85,974 | 38 | 2026-08-18 | 2026-09-18 | 2026-07-11 |
| IBKR | 51% | 81% | 51% | 3,301 | 1,647 | 1,654 | 27,026 | 10 | 2026-07-21 | 2026-09-18 | 2026-07-11 |
| IBM | 52% | 91% | 45% | 46,186 | 32,448 | 13,738 | 394,656 | 11 | 2026-07-22 | 2026-09-18 | 2026-07-11 |
| IEF | 6% | 32% | 100% | 20,608 | 20,186 | 422 | 104,218 | 2026-09-18 | 2026-07-11 | ||
| INDA | 30% | 91% | 32% | 784 | 730 | 54 | 14,669 | 2026-09-18 | 2026-07-11 | ||
| INFY | 63% | 72% | 48% | 533 | 286 | 247 | 26,974 | 12 | 2026-07-23 | 2026-09-18 | 2026-07-11 |
| INTC | 78% | 73% | 62% | 635,724 | 358,868 | 276,856 | 3,610,646 | 12 | 2026-07-23 | 2026-09-18 | 2026-07-11 |
| INTU | 48% | 55% | 36% | 10,098 | 6,293 | 3,805 | 95,184 | 40 | 2026-08-20 | 2026-09-18 | 2026-07-11 |
| IONQ | 88% | 28% | 30% | 57,222 | 26,403 | 30,819 | 536,245 | 32 | 2026-08-12 | 2026-09-18 | 2026-07-11 |
| IONS | 55% | 56% | 15% | 12,293 | 6,020 | 6,273 | 56,222 | 25 | 2026-08-05 | 2026-09-18 | 2026-07-11 |
| IOT | 64% | 50% | 26% | 1,678 | 1,311 | 367 | 39,298 | 47 | 2026-08-27 | 2026-09-18 | 2026-07-11 |
| IREN | 120% | 71% | 45% | 480,556 | 199,992 | 280,564 | 2,235,612 | 67 | 2026-09-16 | 2026-09-18 | 2026-07-11 |
| ISRG | 57% | 96% | 73% | 6,003 | 3,621 | 2,382 | 67,862 | 5 | 2026-07-16 | 2026-09-18 | 2026-07-11 |
| IWM | 14% | 2% | 6% | 1,396,148 | 658,016 | 738,132 | 5,285,116 | 2026-09-18 | 2026-07-11 | ||
| IYR | 14% | 8% | 0% | 1,906 | 642 | 1,264 | 44,623 | 2026-09-18 | 2026-07-11 | ||
| JD | 41% | 56% | 44% | 41,479 | 38,146 | 3,333 | 533,692 | 33 | 2026-08-13 | 2026-09-18 | 2026-07-11 |
| JNJ | 29% | 91% | 34% | 47,106 | 25,835 | 21,271 | 242,516 | 4 | 2026-07-15 | 2026-09-18 | 2026-07-11 |
| JPM | 28% | 75% | 53% | 63,705 | 41,538 | 22,167 | 495,883 | 3 | 2026-07-14 | 2026-09-18 | 2026-07-11 |
| KEY | 38% | 68% | 97% | 2,497 | 1,966 | 531 | 35,545 | 10 | 2026-07-21 | 2026-09-18 | 2026-07-11 |
| KGC | 58% | 66% | 45% | 2,671 | 1,903 | 768 | 57,919 | 18 | 2026-07-29 | 2026-09-18 | 2026-07-11 |
| KHC | 26% | 25% | 100% | 15,174 | 11,758 | 3,416 | 246,806 | 25 | 2026-08-05 | 2026-09-18 | 2026-07-11 |
| KKR | 44% | 45% | 41% | 4,484 | 2,525 | 1,959 | 61,210 | 19 | 2026-07-30 | 2026-09-18 | 2026-07-11 |
| KLAC | 89% | 96% | 82% | 7,244 | 3,809 | 3,435 | 119,430 | 12 | 2026-07-23 | 2026-09-18 | 2026-07-11 |
| KLAR | 65% | 6% | 9% | 7,779 | 4,983 | 2,796 | 61,460 | 53 | 2026-09-02 | 2026-09-18 | 2026-07-11 |
| KMB | 27% | 45% | 33% | 2,824 | 1,938 | 886 | 60,001 | 24 | 2026-08-04 | 2026-09-18 | 2026-07-11 |
| KMI | 29% | 77% | 89% | 20,075 | 12,932 | 7,143 | 146,753 | 11 | 2026-07-22 | 2026-09-18 | 2026-07-11 |
| KO | 20% | 58% | 0% | 69,608 | 55,726 | 13,882 | 478,589 | 17 | 2026-07-28 | 2026-09-18 | 2026-07-11 |
| KR | 28% | 45% | 0% | 38,290 | 35,724 | 2,566 | 85,140 | 55 | 2026-09-04 | 2026-09-18 | 2026-07-11 |
| KRE | 27% | 28% | 11% | 23,495 | 5,753 | 17,742 | 972,235 | 2026-09-18 | 2026-07-11 | ||
| KSA | 42% | 51% | 1% | 3 | 0 | 3 | 0 | 2026-09-18 | 2026-07-11 | ||
| KSS | 62% | 11% | 8% | 3,966 | 2,537 | 1,429 | 38,639 | 33 | 2026-08-13 | 2026-09-18 | 2026-07-11 |
| KVUE | 15% | 1% | 100% | 16,179 | 14,808 | 1,371 | 65,876 | 32 | 2026-08-12 | 2026-09-18 | 2026-07-11 |
| KWEB | 29% | 21% | 1% | 59,709 | 42,755 | 16,954 | 2,002,885 | 2026-09-18 | 2026-07-11 | ||
| LI | 63% | 76% | 53% | 4,647 | 3,097 | 1,550 | 33,897 | 53 | 2026-09-02 | 2026-09-18 | 2026-07-11 |
| LITE | 92% | 39% | 43% | 25,402 | 13,582 | 11,820 | 96,219 | 38 | 2026-08-18 | 2026-09-18 | 2026-07-11 |
| LLY | 34% | 29% | 24% | 48,512 | 26,527 | 21,985 | 181,761 | 25 | 2026-08-05 | 2026-09-18 | 2026-07-11 |
| LMND | 78% | 37% | 14% | 4,693 | 2,942 | 1,751 | 46,584 | 25 | 2026-08-05 | 2026-09-18 | 2026-07-11 |
| LMT | 36% | 82% | 55% | 7,735 | 3,299 | 4,436 | 35,914 | 12 | 2026-07-23 | 2026-09-18 | 2026-07-11 |
| LNG | 73% | 100% | 100% | 7,304 | 6,355 | 949 | 35,185 | 19 | 2026-07-30 | 2026-09-18 | 2026-07-11 |
| LOW | 32% | 65% | 47% | 6,802 | 3,979 | 2,823 | 62,289 | 39 | 2026-08-19 | 2026-09-18 | 2026-07-11 |
| LPTH | 42% | 1% | 75% | 2,030 | 1,502 | 528 | 40,180 | 61 | 2026-09-10 | 2026-09-18 | 2026-07-11 |
| LQD | 10% | 93% | 87% | 27,928 | 7,772 | 20,156 | 359,895 | 2026-09-18 | 2026-07-11 | ||
| LRCX | 94% | 98% | 90% | 55,284 | 27,826 | 27,458 | 367,407 | 18 | 2026-07-29 | 2026-09-18 | 2026-07-11 |
| LULU | 46% | 47% | 17% | 45,199 | 35,530 | 9,669 | 183,933 | 47 | 2026-08-27 | 2026-09-18 | 2026-07-11 |
| LUNR | 106% | 23% | 47% | 27,824 | 13,451 | 14,373 | 229,829 | 38 | 2026-08-18 | 2026-09-18 | 2026-07-11 |
| LUV | 54% | 67% | 47% | 11,693 | 7,257 | 4,436 | 129,057 | 11 | 2026-07-22 | 2026-09-18 | 2026-07-11 |
| LVS | 43% | 67% | 8% | 2,465 | 1,349 | 1,116 | 34,672 | 11 | 2026-07-22 | 2026-09-18 | 2026-07-11 |
| LYB | 47% | 23% | 100% | 1,626 | 1,181 | 445 | 32,085 | 20 | 2026-07-31 | 2026-09-18 | 2026-07-11 |
| LYFT | 60% | 61% | 89% | 24,008 | 18,679 | 5,329 | 369,760 | 32 | 2026-08-12 | 2026-09-18 | 2026-07-11 |
| M | 46% | 27% | 9% | 5,433 | 3,312 | 2,121 | 64,564 | 45 | 2026-08-25 | 2026-09-18 | 2026-07-11 |
| MA | 28% | 66% | 56% | 6,307 | 2,711 | 3,596 | 61,833 | 19 | 2026-07-30 | 2026-09-18 | 2026-07-11 |
| MARA | 95% | 74% | 100% | 302,390 | 236,154 | 66,236 | 1,318,827 | 32 | 2026-08-12 | 2026-09-18 | 2026-07-11 |
| MAT | 56% | 71% | 46% | 1,962 | 1,887 | 75 | 36,361 | 24 | 2026-08-04 | 2026-09-18 | 2026-07-11 |
| MCD | 22% | 72% | 96% | 14,784 | 9,983 | 4,801 | 169,823 | 24 | 2026-08-04 | 2026-09-18 | 2026-07-11 |
| MCHP | 72% | 88% | 100% | 11,162 | 5,782 | 5,380 | 110,495 | 24 | 2026-08-04 | 2026-09-18 | 2026-07-11 |
| MDB | 60% | 45% | 27% | 14,965 | 6,913 | 8,052 | 84,445 | 47 | 2026-08-27 | 2026-09-18 | 2026-07-11 |
| MDLZ | 27% | 49% | 100% | 2,038 | 693 | 1,345 | 42,297 | 17 | 2026-07-28 | 2026-09-18 | 2026-07-11 |
| MDT | 23% | 48% | 100% | 8,805 | 6,750 | 2,055 | 131,918 | 45 | 2026-08-25 | 2026-09-18 | 2026-07-11 |
| META | 48% | 92% | 60% | 1,633,495 | 1,098,192 | 535,303 | 2,729,914 | 18 | 2026-07-29 | 2026-09-18 | 2026-07-11 |
| METC | 106% | 54% | 13% | 5,965 | 5,793 | 172 | 67,493 | 31 | 2026-08-11 | 2026-09-18 | 2026-07-11 |
| MKC | 98% | 93% | 100% | 429 | 184 | 245 | 29,234 | 87 | 2026-10-06 | 2026-09-18 | 2026-07-11 |
| MMM | 39% | 82% | 55% | 11,618 | 2,554 | 9,064 | 66,259 | 10 | 2026-07-21 | 2026-09-18 | 2026-07-11 |
| MO | 23% | 50% | 41% | 15,422 | 10,178 | 5,244 | 190,152 | 19 | 2026-07-30 | 2026-09-18 | 2026-07-11 |
| MOS | 49% | 43% | 28% | 20,721 | 6,099 | 14,622 | 187,966 | 23 | 2026-08-03 | 2026-09-18 | 2026-07-11 |
| MP | 70% | 19% | 21% | 13,837 | 8,307 | 5,530 | 183,680 | 19 | 2026-07-30 | 2026-09-18 | 2026-07-11 |
| MPC | 39% | 55% | 0% | 2,992 | 2,328 | 664 | 26,240 | 24 | 2026-08-04 | 2026-09-18 | 2026-07-11 |
| MPLX | 41% | 40% | 1% | 911 | 472 | 439 | 33,464 | 24 | 2026-08-04 | 2026-09-18 | 2026-07-11 |
| MRAM | 112% | 15% | 4% | 1,618 | 1,423 | 195 | 25,806 | 26 | 2026-08-06 | 2026-09-18 | 2026-07-11 |
| MRK | 27% | 26% | 28% | 22,935 | 19,648 | 3,287 | 224,794 | 24 | 2026-08-04 | 2026-09-18 | 2026-07-11 |
| MRNA | 85% | 81% | 100% | 122,070 | 97,211 | 24,859 | 414,388 | 19 | 2026-07-30 | 2026-09-18 | 2026-07-11 |
| MRVL | 91% | 82% | 52% | 170,396 | 94,310 | 76,086 | 1,082,356 | 40 | 2026-08-20 | 2026-09-18 | 2026-07-11 |
| MS | 38% | 83% | 100% | 10,949 | 5,449 | 5,500 | 157,628 | 4 | 2026-07-15 | 2026-09-18 | 2026-07-11 |
| MSFT | 37% | 92% | 48% | 733,323 | 574,887 | 158,436 | 3,866,903 | 18 | 2026-07-29 | 2026-09-18 | 2026-07-11 |
| MSTR | 81% | 81% | 38% | 561,060 | 377,248 | 183,812 | 1,975,888 | 24 | 2026-08-04 | 2026-09-18 | 2026-07-11 |
| MXL | 126% | 82% | 0% | 1,837 | 1,183 | 654 | 41,542 | 12 | 2026-07-23 | 2026-09-18 | 2026-07-11 |
| NBIS | 125% | 93% | 78% | 176,527 | 93,985 | 82,542 | 931,650 | 18 | 2026-07-29 | 2026-09-18 | 2026-07-11 |
| NCLH | 54% | 47% | 99% | 21,114 | 13,177 | 7,937 | 259,713 | 19 | 2026-07-30 | 2026-09-18 | 2026-07-11 |
| NEE | 24% | 16% | 0% | 12,139 | 7,365 | 4,774 | 220,555 | 18 | 2026-07-29 | 2026-09-18 | 2026-07-11 |
| NEM | 52% | 64% | 4% | 11,495 | 7,275 | 4,220 | 287,573 | 12 | 2026-07-23 | 2026-09-18 | 2026-07-11 |
| NET | 63% | 52% | 28% | 21,756 | 9,252 | 12,504 | 152,777 | 19 | 2026-07-30 | 2026-09-18 | 2026-07-11 |
| NFLX | 59% | 97% | 68% | 588,451 | 408,483 | 179,968 | 3,991,588 | 5 | 2026-07-16 | 2026-09-18 | 2026-07-11 |
| NKE | 33% | 30% | 15% | 161,947 | 123,947 | 38,000 | 1,375,102 | 75 | 2026-09-24 | 2026-09-18 | 2026-07-11 |
| NLY | 17% | 5% | 64% | 4,233 | 2,475 | 1,758 | 69,785 | 10 | 2026-07-21 | 2026-09-18 | 2026-07-11 |
| NN | 121% | 54% | 39% | 22,750 | 21,712 | 1,038 | 258,565 | 32 | 2026-08-12 | 2026-09-18 | 2026-07-11 |
| NOK | 74% | 41% | 43% | 133,432 | 107,950 | 25,482 | 3,086,939 | 12 | 2026-07-23 | 2026-09-18 | 2026-07-11 |
| NOW | 71% | 92% | 55% | 116,635 | 86,807 | 29,828 | 1,067,570 | 11 | 2026-07-22 | 2026-09-18 | 2026-07-11 |
| NTLA | 103% | 48% | 99% | 5,352 | 3,961 | 1,391 | 56,211 | 19 | 2026-07-30 | 2026-09-18 | 2026-07-11 |
| NU | 42% | 43% | 0% | 34,523 | 28,173 | 6,350 | 1,368,665 | 38 | 2026-08-18 | 2026-09-18 | 2026-07-11 |
| NUGT | 112% | 76% | 2% | 1,980 | 1,119 | 861 | 4,322 | 2026-09-18 | 2026-07-11 | ||
| NVDA | 36% | 32% | 0% | 5,512,881 | 3,964,706 | 1,548,175 | 12,436,786 | 46 | 2026-08-26 | 2026-09-18 | 2026-07-11 |
| NVO | 38% | 17% | 15% | 40,228 | 21,908 | 18,320 | 932,586 | 25 | 2026-08-05 | 2026-09-18 | 2026-07-11 |
| NVTS | 112% | 19% | 29% | 54,585 | 44,021 | 10,564 | 381,991 | 16 | 2026-07-27 | 2026-09-18 | 2026-07-11 |
| o | 27% | 67% | 100% | 2,232 | 1,716 | 516 | 76,640 | 25 | 2026-08-05 | 2026-09-18 | 2026-07-11 |
| OKE | 27% | 17% | 100% | 1,056 | 668 | 388 | 57,110 | 30 | 2026-08-10 | 2026-09-18 | 2026-07-11 |
| OKLO | 81% | 6% | 10% | 59,928 | 41,669 | 18,259 | 523,970 | 38 | 2026-08-18 | 2026-09-18 | 2026-07-11 |
| OKTA | 59% | 63% | 3% | 7,234 | 3,359 | 3,875 | 63,153 | 53 | 2026-09-02 | 2026-09-18 | 2026-07-11 |
| ON | 81% | 86% | 62% | 23,770 | 13,389 | 10,381 | 175,341 | 23 | 2026-08-03 | 2026-09-18 | 2026-07-11 |
| ONON | 48% | 41% | 23% | 12,975 | 11,383 | 1,592 | 102,772 | 38 | 2026-08-18 | 2026-09-18 | 2026-07-11 |
| ORCL | 56% | 53% | 29% | 407,456 | 291,802 | 115,654 | 2,167,028 | 65 | 2026-09-14 | 2026-09-18 | 2026-07-11 |
| ORLY | 50% | 91% | 95% | 2,821 | 1,311 | 1,510 | 26,067 | 18 | 2026-07-29 | 2026-09-18 | 2026-07-11 |
| OSCR | 80% | 52% | 1% | 26,616 | 18,661 | 7,955 | 318,538 | 26 | 2026-08-06 | 2026-09-18 | 2026-07-11 |
| OXY | 32% | 30% | 25% | 49,833 | 42,460 | 7,373 | 561,138 | 25 | 2026-08-05 | 2026-09-18 | 2026-07-11 |
| PANW | 56% | 84% | 4% | 30,374 | 15,244 | 15,130 | 257,508 | 44 | 2026-08-24 | 2026-09-18 | 2026-07-11 |
| PATH | 66% | 44% | 28% | 33,521 | 27,043 | 6,478 | 572,557 | 59 | 2026-09-08 | 2026-09-18 | 2026-07-11 |
| PBI | 122% | 97% | 99% | 5,920 | 5,657 | 263 | 47,149 | 25 | 2026-08-05 | 2026-09-18 | 2026-07-11 |
| PBR | 34% | 29% | 35% | 24,805 | 11,578 | 13,227 | 712,377 | 26 | 2026-08-06 | 2026-09-18 | 2026-07-11 |
| PCG | 38% | 51% | 45% | 11,701 | 9,923 | 1,778 | 737,401 | 12 | 2026-07-23 | 2026-09-18 | 2026-07-11 |
| PDD | 39% | 61% | 30% | 30,498 | 18,559 | 11,939 | 528,815 | 51 | 2026-08-31 | 2026-09-18 | 2026-07-11 |
| PENG | 107% | 56% | 0% | 14,028 | 7,449 | 6,579 | 63,724 | 94 | 2026-10-13 | 2026-09-18 | 2026-07-11 |
| PEP | 24% | 46% | 0% | 43,369 | 24,552 | 18,817 | 335,881 | 94 | 2026-10-13 | 2026-09-18 | 2026-07-11 |
| PFE | 27% | 54% | 0% | 62,418 | 44,484 | 17,934 | 2,023,864 | 24 | 2026-08-04 | 2026-09-18 | 2026-07-11 |
| PG | 28% | 89% | 13% | 46,794 | 41,722 | 5,072 | 299,831 | 18 | 2026-07-29 | 2026-09-18 | 2026-07-11 |
| PINS | 57% | 64% | 0% | 11,794 | 6,526 | 5,268 | 160,646 | 24 | 2026-08-04 | 2026-09-18 | 2026-07-11 |
| PL | 100% | 39% | 27% | 17,333 | 11,278 | 6,055 | 174,831 | 65 | 2026-09-14 | 2026-09-18 | 2026-07-11 |
| PLTR | 50% | 33% | 25% | 658,621 | 457,723 | 200,898 | 2,907,422 | 30 | 2026-08-10 | 2026-09-18 | 2026-07-11 |
| PM | 35% | 75% | 0% | 4,987 | 3,435 | 1,552 | 58,617 | 11 | 2026-07-22 | 2026-09-18 | 2026-07-11 |
| PYPL | 40% | 61% | 35% | 98,669 | 71,294 | 27,375 | 1,231,691 | 17 | 2026-07-28 | 2026-09-18 | 2026-07-11 |
| PZZA | 88% | 79% | 0% | 927 | 764 | 163 | 41,101 | 26 | 2026-08-06 | 2026-09-18 | 2026-07-11 |
| Q | 62% | 42% | 19% | 1,061 | 234 | 827 | 30,429 | 24 | 2026-08-04 | 2026-09-18 | 2026-07-11 |
| QBTS | 92% | 21% | 23% | 39,827 | 26,949 | 12,878 | 413,652 | 26 | 2026-08-06 | 2026-09-18 | 2026-07-11 |
| QCOM | 65% | 82% | 100% | 77,256 | 47,372 | 29,884 | 692,975 | 25 | 2026-08-05 | 2026-09-18 | 2026-07-11 |
| QSR | 36% | 73% | 0% | 6,041 | 5,971 | 70 | 36,360 | 26 | 2026-08-06 | 2026-09-18 | 2026-07-11 |
| QXO | 60% | 39% | 0% | 53,119 | 37,706 | 15,413 | 344,059 | 31 | 2026-08-11 | 2026-09-18 | 2026-07-11 |
| RBLX | 82% | 83% | 41% | 21,911 | 13,526 | 8,385 | 188,974 | 32 | 2026-08-12 | 2026-09-18 | 2026-07-11 |
| RBRK | 66% | 43% | 34% | 4,534 | 3,343 | 1,191 | 65,730 | 65 | 2026-09-14 | 2026-09-18 | 2026-07-11 |
| RCL | 53% | 65% | 41% | 2,093 | 1,163 | 930 | 42,123 | 17 | 2026-07-28 | 2026-09-18 | 2026-07-11 |
| RDDT | 77% | 63% | 32% | 45,074 | 28,866 | 16,208 | 274,926 | 31 | 2026-08-11 | 2026-09-18 | 2026-07-11 |
| RGTI | 93% | 31% | 24% | 47,964 | 31,542 | 16,422 | 553,097 | 26 | 2026-08-06 | 2026-09-18 | 2026-07-11 |
| RIO | 40% | 75% | 37% | 3,105 | 2,651 | 454 | 56,098 | 18 | 2026-07-29 | 2026-09-18 | 2026-07-11 |
| RIOT | 83% | 28% | 36% | 42,250 | 27,188 | 15,062 | 578,489 | 19 | 2026-07-30 | 2026-09-18 | 2026-07-11 |
| RIVN | 62% | 31% | 19% | 182,173 | 109,497 | 72,676 | 1,595,638 | 19 | 2026-07-30 | 2026-09-18 | 2026-07-11 |
| RKLB | 84% | 16% | 26% | 145,743 | 96,388 | 49,355 | 817,369 | 26 | 2026-08-06 | 2026-09-18 | 2026-07-11 |
| RKT | 60% | 26% | 29% | 36,748 | 29,885 | 6,863 | 484,166 | 19 | 2026-07-30 | 2026-09-18 | 2026-07-11 |
| ROKU | 18% | 0% | 0% | 4,677 | 4,167 | 510 | 27,107 | 19 | 2026-07-30 | 2026-09-18 | 2026-07-11 |
| RTX | 36% | 88% | 100% | 7,527 | 4,497 | 3,030 | 97,853 | 12 | 2026-07-23 | 2026-09-18 | 2026-07-11 |
| RUN | 77% | 16% | 26% | 20,286 | 12,164 | 8,122 | 346,187 | 25 | 2026-08-05 | 2026-09-18 | 2026-07-11 |
| RVMD | 52% | 31% | 30% | 1,270 | 945 | 325 | 34,702 | 32 | 2026-08-12 | 2026-09-18 | 2026-07-11 |
| S | 48% | 22% | 81% | 19,121 | 16,198 | 2,923 | 125,773 | 47 | 2026-08-27 | 2026-09-18 | 2026-07-11 |
| SBUX | 36% | 76% | 32% | 17,747 | 9,922 | 7,825 | 306,857 | 24 | 2026-08-04 | 2026-09-18 | 2026-07-11 |
| SCHW | 34% | 81% | 100% | 19,257 | 11,422 | 7,835 | 304,252 | 10 | 2026-07-21 | 2026-09-18 | 2026-07-11 |
| SE | 54% | 51% | 33% | 22,128 | 15,079 | 7,049 | 132,197 | 38 | 2026-08-18 | 2026-09-18 | 2026-07-11 |
| SEDG | 114% | 68% | 44% | 4,765 | 2,418 | 2,347 | 75,891 | 24 | 2026-08-04 | 2026-09-18 | 2026-07-11 |
| SFM | 66% | 76% | 29% | 2,122 | 1,694 | 428 | 28,903 | 18 | 2026-07-29 | 2026-09-18 | 2026-07-11 |
| SGI | 47% | 50% | 20% | 6,463 | 6,330 | 133 | 29,787 | 12 | 2026-07-23 | 2026-09-18 | 2026-07-11 |
| SHEL | 27% | 56% | 1% | 36,076 | 35,861 | 215 | 59,742 | 19 | 2026-07-30 | 2026-09-18 | 2026-07-11 |
| SHOO | 69% | 47% | 100% | 189 | 189 | 0 | 25,042 | 25 | 2026-08-05 | 2026-09-18 | 2026-07-11 |
| SHOP | 59% | 52% | 32% | 70,645 | 33,256 | 37,389 | 496,297 | 25 | 2026-08-05 | 2026-09-18 | 2026-07-11 |
| SIRI | 32% | 10% | 17% | 63,106 | 62,025 | 1,081 | 87,685 | 19 | 2026-07-30 | 2026-09-18 | 2026-07-11 |
| SKM | 112% | 80% | 100% | 3,583 | 2,242 | 1,341 | 94,319 | 31 | 2026-08-11 | 2026-09-18 | 2026-07-11 |
| SLB | 36% | 36% | 25% | 9,890 | 6,414 | 3,476 | 493,456 | 13 | 2026-07-24 | 2026-09-18 | 2026-07-11 |
| SLS | 215% | 36% | 28% | 31,952 | 22,320 | 9,632 | 588,648 | 26 | 2026-08-06 | 2026-09-18 | 2026-07-11 |
| SLV | 35% | 29% | 0% | 394,515 | 263,899 | 130,616 | 4,055,552 | 2026-09-18 | 2026-07-11 | ||
| SMCI | 83% | 69% | 42% | 310,335 | 253,123 | 57,212 | 1,438,747 | 31 | 2026-08-11 | 2026-09-18 | 2026-07-11 |
| SNOW | 54% | 48% | 24% | 40,399 | 26,528 | 13,871 | 239,399 | 46 | 2026-08-26 | 2026-09-18 | 2026-07-11 |
| SNY | 43% | 71% | 92% | 4,212 | 3,546 | 666 | 27,767 | 2026-09-18 | 2026-07-11 | ||
| SO | 19% | 29% | 20% | 2,604 | 2,202 | 402 | 35,412 | 19 | 2026-07-30 | 2026-09-18 | 2026-07-11 |
| SOFI | 61% | 38% | 37% | 692,420 | 532,138 | 160,282 | 3,694,165 | 18 | 2026-07-29 | 2026-09-18 | 2026-07-11 |
| SONY | 33% | 24% | 2% | 7,531 | 6,991 | 540 | 118,273 | 26 | 2026-08-06 | 2026-09-18 | 2026-07-11 |
| SPCX | 72% | 6% | 2% | 568,933 | 292,983 | 275,950 | 2,686,294 | 26 | 2026-08-06 | 2026-09-18 | 2026-07-11 |
| SPOT | 47% | 48% | 31% | 12,144 | 5,556 | 6,588 | 46,686 | 24 | 2026-08-04 | 2026-09-18 | 2026-07-11 |
| SPXU | 46% | 49% | 100% | 1,821 | 1,503 | 318 | 11,665 | 2026-09-18 | 2026-07-11 | ||
| STRC | 41% | 79% | 94% | 2,823 | 1,967 | 856 | 64,996 | 24 | 2026-08-04 | 2026-09-18 | 2026-07-11 |
| STUB | 96% | 33% | 37% | 5,249 | 4,216 | 1,033 | 61,785 | 53 | 2026-09-02 | 2026-09-18 | 2026-07-11 |
| STX | 109% | 97% | 84% | 19,093 | 10,451 | 8,642 | 73,738 | 5 | 2026-07-16 | 2026-09-18 | 2026-07-11 |
| STZ | 35% | 50% | 29% | 5,863 | 2,563 | 3,300 | 34,362 | 82 | 2026-10-01 | 2026-09-18 | 2026-07-11 |
| SU | 40% | 78% | 85% | 2,594 | 1,969 | 625 | 54,164 | 31 | 2026-08-11 | 2026-09-18 | 2026-07-11 |
| SWKS | 75% | 92% | 32% | 1,054 | 604 | 450 | 65,805 | 25 | 2026-08-05 | 2026-09-18 | 2026-07-11 |
| T | 42% | 96% | 93% | 53,469 | 38,763 | 14,706 | 931,764 | 11 | 2026-07-22 | 2026-09-18 | 2026-07-11 |
| TBIL | 6% | 21% | 0% | 0 | 0 | 0 | 0 | 2026-09-18 | 2026-07-11 | ||
| TBT | 26% | 53% | 100% | 140 | 110 | 30 | 3,108 | 2026-09-18 | 2026-07-11 | ||
| TCOM | 96% | 94% | 87% | 8,426 | 4,031 | 4,395 | 36,562 | 68 | 2026-09-17 | 2026-09-18 | 2026-07-11 |
| TEAM | 80% | 63% | 44% | 8,490 | 6,866 | 1,624 | 63,959 | 19 | 2026-07-30 | 2026-09-18 | 2026-07-11 |
| TEM | 79% | 55% | 86% | 19,909 | 15,241 | 4,668 | 277,042 | 26 | 2026-08-06 | 2026-09-18 | 2026-07-11 |
| TER | 108% | 94% | 4% | 7,130 | 4,773 | 2,357 | 30,179 | 17 | 2026-07-28 | 2026-09-18 | 2026-07-11 |
| TEVA | 45% | 53% | 5% | 1,700 | 930 | 770 | 115,944 | 18 | 2026-07-29 | 2026-09-18 | 2026-07-11 |
| TFC | 9167% | 100% | 100% | 3,188 | 1,772 | 1,416 | 69,684 | 5 | 2026-07-16 | 2026-09-18 | 2026-07-11 |
| TGT | 34% | 39% | 14% | 25,502 | 14,752 | 10,750 | 234,385 | 39 | 2026-08-19 | 2026-09-18 | 2026-07-11 |
| THD | 100% | 86% | 94% | 21 | 16 | 5 | 0 | 2026-09-18 | 2026-07-11 | ||
| TJX | 23% | 50% | 30% | 4,020 | 2,871 | 1,149 | 59,654 | 39 | 2026-08-19 | 2026-09-18 | 2026-07-11 |
| TLT | 7% | 2% | 100% | 455,717 | 334,806 | 120,911 | 6,565,933 | 2026-09-18 | 2026-07-11 | ||
| TMUS | 45% | 95% | 97% | 3,355 | 2,161 | 1,194 | 79,002 | 12 | 2026-07-23 | 2026-09-18 | 2026-07-11 |
| TOST | 51% | 39% | 26% | 13,081 | 11,470 | 1,611 | 185,608 | 31 | 2026-08-11 | 2026-09-18 | 2026-07-11 |
| TRIP | 156% | 96% | 100% | 14,912 | 14,592 | 320 | 75,980 | 19 | 2026-07-30 | 2026-09-18 | 2026-07-11 |
| TSCO | 52% | 89% | 11% | 2,760 | 1,253 | 1,507 | 75,184 | 12 | 2026-07-23 | 2026-09-18 | 2026-07-11 |
| TSLA | 44% | 47% | 22% | 3,455,569 | 2,195,399 | 1,260,170 | 4,213,817 | 11 | 2026-07-22 | 2026-09-18 | 2026-07-11 |
| TSM | 54% | 94% | 100% | 173,118 | 77,537 | 95,581 | 1,457,005 | 5 | 2026-07-16 | 2026-09-18 | 2026-07-11 |
| TTD | 74% | 70% | 96% | 34,214 | 22,798 | 11,416 | 621,059 | 26 | 2026-08-06 | 2026-09-18 | 2026-07-11 |
| TTWO | 43% | 59% | 57% | 11,686 | 5,111 | 6,575 | 156,497 | 30 | 2026-08-10 | 2026-09-18 | 2026-07-11 |
| TWLO | 63% | 63% | 39% | 3,192 | 1,902 | 1,290 | 29,106 | 19 | 2026-07-30 | 2026-09-18 | 2026-07-11 |
| TXN | 73% | 98% | 0% | 17,330 | 13,564 | 3,766 | 122,748 | 11 | 2026-07-22 | 2026-09-18 | 2026-07-11 |
| UAL | 61% | 75% | 52% | 20,421 | 13,505 | 6,916 | 137,980 | 4 | 2026-07-15 | 2026-09-18 | 2026-07-11 |
| UBER | 36% | 40% | 31% | 93,604 | 61,511 | 32,093 | 860,096 | 24 | 2026-08-04 | 2026-09-18 | 2026-07-11 |
| UNG | 46% | 17% | 33% | 38,378 | 27,261 | 11,117 | 270,050 | 2026-09-18 | 2026-07-11 | ||
| UNH | 42% | 84% | 6% | 48,335 | 27,000 | 21,335 | 644,499 | 5 | 2026-07-16 | 2026-09-18 | 2026-07-11 |
| UNL | 208 | 206 | 2 | 1 | 2026-09-18 | 2026-07-11 | |||||
| UNM | 39% | 83% | 97% | 1,108 | 353 | 755 | 66,102 | 17 | 2026-07-28 | 2026-09-18 | 2026-07-11 |
| UNP | 46% | 98% | 3% | 5,360 | 4,025 | 1,335 | 40,587 | 12 | 2026-07-23 | 2026-09-18 | 2026-07-11 |
| UPS | 35% | 74% | 34% | 23,107 | 17,379 | 5,728 | 258,983 | 17 | 2026-07-28 | 2026-09-18 | 2026-07-11 |
| UPST | 78% | 46% | 22% | 14,969 | 8,680 | 6,289 | 168,999 | 24 | 2026-08-04 | 2026-09-18 | 2026-07-11 |
| URA | 51% | 25% | 99% | 5,796 | 3,741 | 2,055 | 116,846 | 2026-09-18 | 2026-07-11 | ||
| USAR | 80% | 1% | 1% | 18,000 | 10,701 | 7,299 | 305,002 | 37 | 2026-08-17 | 2026-09-18 | 2026-07-11 |
| USB | 33% | 76% | 0% | 3,069 | 1,681 | 1,388 | 82,485 | 5 | 2026-07-16 | 2026-09-18 | 2026-07-11 |
| USO | 40% | 55% | 2% | 136,053 | 94,155 | 41,898 | 1,056,805 | 2026-09-18 | 2026-07-11 | ||
| UUP | 14% | 31% | 96% | 1,371 | 1,294 | 77 | 94,036 | 2026-09-18 | 2026-07-11 | ||
| V | 24% | 49% | 54% | 20,045 | 12,841 | 7,204 | 273,165 | 17 | 2026-07-28 | 2026-09-18 | 2026-07-11 |
| VALE | 30% | 12% | 0% | 23,026 | 22,181 | 845 | 487,253 | 19 | 2026-07-30 | 2026-09-18 | 2026-07-11 |
| VELO | 150% | 21% | 87% | 2,258 | 1,616 | 642 | 43,613 | 32 | 2026-08-12 | 2026-09-18 | 2026-07-11 |
| VFC | 61% | 41% | 25% | 5,429 | 3,517 | 1,912 | 192,140 | 18 | 2026-07-29 | 2026-09-18 | 2026-07-11 |
| VIAV | 99% | 79% | 1% | 1,188 | 835 | 353 | 37,080 | 26 | 2026-08-06 | 2026-09-18 | 2026-07-11 |
| VICI | 45% | 50% | 99% | 1,296 | 1,067 | 229 | 40,705 | 18 | 2026-07-29 | 2026-09-18 | 2026-07-11 |
| VKTX | 80% | 38% | 19% | 13,209 | 9,475 | 3,734 | 142,030 | 18 | 2026-07-29 | 2026-09-18 | 2026-07-11 |
| VLO | 44% | 68% | 54% | 6,585 | 3,552 | 3,033 | 45,517 | 19 | 2026-07-30 | 2026-09-18 | 2026-07-11 |
| VNM | 44% | 39% | 100% | 7 | 3 | 4 | 0 | 2026-09-18 | 2026-07-11 | ||
| VRT | 79% | 89% | 65% | 25,659 | 10,135 | 15,524 | 221,058 | 25 | 2026-08-05 | 2026-09-18 | 2026-07-11 |
| VSAT | 85% | 37% | 12% | 4,850 | 4,151 | 699 | 49,274 | 32 | 2026-08-12 | 2026-09-18 | 2026-07-11 |
| VST | 53% | 31% | 31% | 15,495 | 11,259 | 4,236 | 266,356 | 27 | 2026-08-07 | 2026-09-18 | 2026-07-11 |
| VZ | 33% | 93% | 99% | 70,742 | 43,315 | 27,427 | 1,024,225 | 13 | 2026-07-24 | 2026-09-18 | 2026-07-11 |
| W | 71% | 48% | 26% | 9,700 | 4,049 | 5,651 | 48,904 | 24 | 2026-08-04 | 2026-09-18 | 2026-07-11 |
| WBD | 46% | 72% | 42% | 73,435 | 30,119 | 43,316 | 1,614,261 | 19 | 2026-07-30 | 2026-09-18 | 2026-07-11 |
| WDAY | 56% | 54% | 37% | 4,290 | 2,156 | 2,134 | 46,317 | 40 | 2026-08-20 | 2026-09-18 | 2026-07-11 |
| WDC | 100% | 89% | 81% | 61,887 | 29,748 | 32,139 | 219,369 | 25 | 2026-08-05 | 2026-09-18 | 2026-07-11 |
| WFC | 40% | 93% | 76% | 60,133 | 35,658 | 24,475 | 563,709 | 3 | 2026-07-14 | 2026-09-18 | 2026-07-11 |
| WHR | 75% | 87% | 54% | 7,855 | 4,613 | 3,242 | 81,388 | 16 | 2026-07-27 | 2026-09-18 | 2026-07-11 |
| WMB | 31% | 65% | 99% | 10,301 | 2,438 | 7,863 | 143,772 | 30 | 2026-08-10 | 2026-09-18 | 2026-07-11 |
| WMT | 20% | 14% | 0% | 123,259 | 95,425 | 27,834 | 878,177 | 40 | 2026-08-20 | 2026-09-18 | 2026-07-11 |
| WOLF | 143% | 51% | 95% | 134,513 | 82,483 | 52,030 | 166,938 | 39 | 2026-08-19 | 2026-09-18 | 2026-07-11 |
| WT | 44% | 12% | 0% | 375 | 340 | 35 | 25,140 | 13 | 2026-07-24 | 2026-09-18 | 2026-07-11 |
| WULF | 94% | 19% | 31% | 182,483 | 115,552 | 66,931 | 1,852,541 | 37 | 2026-08-17 | 2026-09-18 | 2026-07-11 |
| WYNN | 40% | 31% | 25% | 10,536 | 9,516 | 1,020 | 79,715 | 24 | 2026-08-04 | 2026-09-18 | 2026-07-11 |
| XBI | 35% | 77% | 50% | 72,001 | 28,638 | 43,363 | 358,952 | 2026-09-18 | 2026-07-11 | ||
| XHB | 39% | 67% | 95% | 14,098 | 2,596 | 11,502 | 48,064 | 2026-09-18 | 2026-07-11 | ||
| XLB | 19% | 27% | 0% | 4,649 | 1,696 | 2,953 | 230,159 | 2026-09-18 | 2026-07-11 | ||
| XLE | 26% | 61% | 7% | 106,106 | 66,818 | 39,288 | 2,225,264 | 2026-09-18 | 2026-07-11 | ||
| XLF | 29% | 99% | 91% | 136,637 | 92,326 | 44,311 | 2,869,350 | 2026-09-18 | 2026-07-11 | ||
| XLI | 19% | 49% | 32% | 11,275 | 2,577 | 8,698 | 187,992 | 2026-09-18 | 2026-07-11 | ||
| XLK | 35% | 86% | 62% | 13,054 | 6,351 | 6,703 | 245,661 | 2026-09-18 | 2026-07-11 | ||
| XLP | 15% | 45% | 25% | 17,700 | 12,968 | 4,732 | 240,965 | 2026-09-18 | 2026-07-11 | ||
| XLU | 15% | 19% | 25% | 23,429 | 5,623 | 17,806 | 363,550 | 2026-09-18 | 2026-07-11 | ||
| XLV | 14% | 11% | 29% | 12,179 | 8,379 | 3,800 | 223,916 | 2026-09-18 | 2026-07-11 | ||
| XLY | 23% | 40% | 45% | 21,682 | 3,327 | 18,355 | 234,395 | 2026-09-18 | 2026-07-11 | ||
| XME | 44% | 60% | 26% | 1,502 | 185 | 1,317 | 14,748 | 2026-09-18 | 2026-07-11 | ||
| XOM | 25% | 40% | 0% | 63,174 | 50,750 | 12,424 | 658,706 | 20 | 2026-07-31 | 2026-09-18 | 2026-07-11 |
| XOP | 31% | 33% | 25% | 9,770 | 4,335 | 5,435 | 63,432 | 2026-09-18 | 2026-07-11 | ||
| XPER | 2 | 0 | 2 | 0 | 2026-09-18 | 2026-07-11 | |||||
| XPEV | 74% | 87% | 41% | 9,284 | 7,594 | 1,690 | 315,422 | 45 | 2026-08-25 | 2026-09-18 | 2026-07-11 |
| XRT | 43% | 97% | 100% | 5,338 | 3,621 | 1,717 | 30,265 | 2026-09-18 | 2026-07-11 | ||
| XYZ | 50% | 43% | 27% | 47,621 | 39,320 | 8,301 | 248,369 | 25 | 2026-08-05 | 2026-09-18 | 2026-07-11 |
| Z | 50% | 32% | 99% | 3,811 | 1,088 | 2,723 | 35,735 | 25 | 2026-08-05 | 2026-09-18 | 2026-07-11 |
| ZETA | 70% | 42% | 28% | 25,070 | 18,454 | 6,616 | 303,141 | 25 | 2026-08-05 | 2026-09-18 | 2026-07-11 |
| ZIM | 48% | 21% | 28% | 3,509 | 1,272 | 2,237 | 65,092 | 39 | 2026-08-19 | 2026-09-18 | 2026-07-11 |
| ZM | 40% | 41% | 28% | 6,419 | 3,188 | 3,231 | 135,109 | 44 | 2026-08-24 | 2026-09-18 | 2026-07-11 |
| ZS | 62% | 57% | 100% | 21,594 | 13,422 | 8,172 | 125,157 | 59 | 2026-09-08 | 2026-09-18 | 2026-07-11 |
| ZTS | 52% | 83% | 100% | 2,214 | 918 | 1,296 | 57,617 | 26 | 2026-08-06 | 2026-09-18 | 2026-07-11 |
SlashTraders vs S&P 500: 450% Outperformance, Verified Trades and How to Copy Every Alert
Thank you for the great explanation about IV rank vs IV percentile.
Happy to help.
Thank you for such a clear explanation.
I'll be paying more attention to the IV Percentile next.
By familiarizing yourself with the IV Percentile, you can be more confident in selling options when the IV is high.