
When trading options for profit, a rule of thumb is to sell options when the Implied Volatility is high, and buy options when the IV is lower.
But do you know what market volatility represents in general and how differences in volatility can affect options prices?
In this article, we'll try to provide an in-depth explanation of what market volatility is, because a solid understanding of volatility is important to trading options for consistent income. We also share the differences between Historical Volatility (HV) and Implied Volatility (IV).
Contents
What Is Volatility?
Volatility is the fluctuations and dispersion of data points, and we can use it to indicate the fluctuation of stock prices in the market. Mathematically speaking, volatility is the deviation of the data dispersion.
Thinkorswim shares various market volatility data in the Options Statistics. The most important of them all are Historical Volatility (HV) and Implied Volatility (IV).
What Are the Differences Between HV and IV?
HV is the backward-looking volatility of the underlying, while IV is forward-looking for the theoretically expected future moves.
How to Calculate Historical Volatility?
In case you have left your high school years long behind you, we’ll take it step by step through the process of calculating volatility.
We calculated the volatility of the stock price with reference to a series of recent BABA closing prices. Volatility calculated using historical data is commonly referred to as historical volatility (HV).
We first calculate the daily changes of 10 recent BABA closing prices.
| Trading days | Last | Daily change |
|---|---|---|
| 10/4 | 139.63 | |
| 10/5 | 143.14 | 2.5% |
| 10/6 | 144.10 | 0.7% |
| 10/7 | 156.00 | 8.3% |
| 10/8 | 161.52 | 3.5% |
| 10/11 | 163.95 | 1.5% |
| 10/12 | 163.00 | -0.6% |
| 10/13 | 167.40 | 2.7% |
| 10/14 | 166.78 | -0.4% |
| 10/15 | 168.00 | 0.7% |
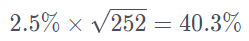
The standard deviation of these 10 daily changes is 2.54%
Since there are around 252 trading days each year, we can transform the 2.54% standard deviation into an annualised number of 40.3%, which is HV.
Then we can compare our HV number with the Thinkorswim HV data.
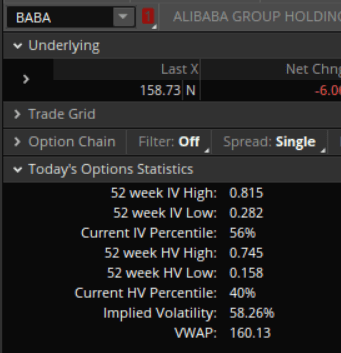
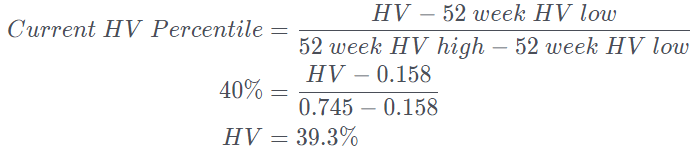
We deduce the Thinkorswim HV from the HV Percentile formula to get a similar number to our calculated HV.
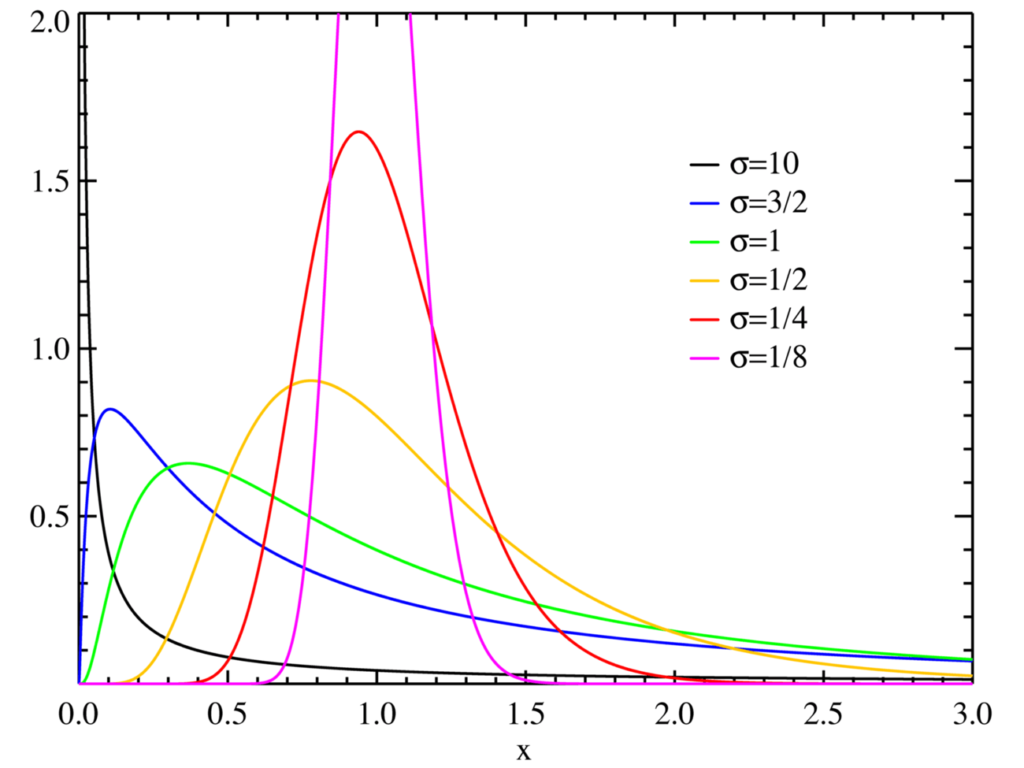
The famous Gaussian normal distribution describes the random outcomes of a data set in our real world where 50% of all outcomes fall on the left side of the mean and the other 50% on the right side of the mean.
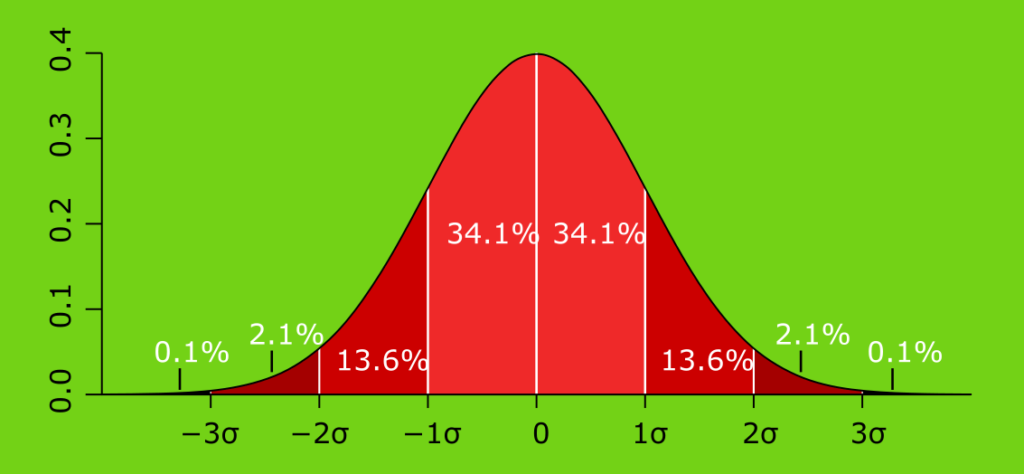
1 standard deviation (σ) on either side of the mean mark the range in which 68% of all fluctuations of the given process would fall. While +/-2σ mark the probability of 95%.
The current closing price for BABA is $158.73, while HV is 40%. So we have a 68% confidence that BABA closing prices will stay within $95.24 and $222.22 in the following year.
If BABA’s closing prices fluctuated more with a bigger standard deviation, its HV would be high.
If the closing prices fluctuated less with a smaller standard deviation, the HV would be low.
How Does IV Affect Options Prices?
Option prices are a function of IV, which is the expected move of the underlying. IV is also calculated from the options pricing model.
Options provide us with rights to sell or buy an asset at a certain price. Such right is inherently associated with a certain cash inflow or outflow and has to be discounted by interest and dividends.
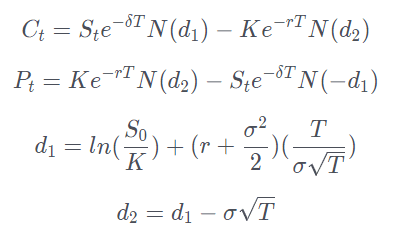
The famous Black Scholes option pricing model was rewarded with a Nobel Prize and provides us with a set of elaborate formulas that allows us to calculate Call and Put option prices. It uses a log-normal distribution model because the price can't go lower than 0, and has a long tail as prices approach infinity.
Call and Put option prices are calculated as follows:
- σ = IV
- δ = dividends
- S = stock price
- K = strike price
- r = risk-free interest rate
- T = time to expiration (year)
- N = normal distribution
- N(d1) = the expected value of cash/stock inflow if option expires ITM
- N(d2) = the probability the option expires ITM
We used the AAPL stock price as an example to calculate the Call for price parity $150, 39 days after cutoff, and used Thinkorswim's option chain to validate our calculations.
- σ = 22.38%
- S = $151.28
- K = $150
- r = 0.04%
- t = 39/365 = 0.106849
- d1 = 0.153314
- d2 = 0.080158
- N(d1) = 0.56
- N(d2) = 0.53
- C(39) = $5.05
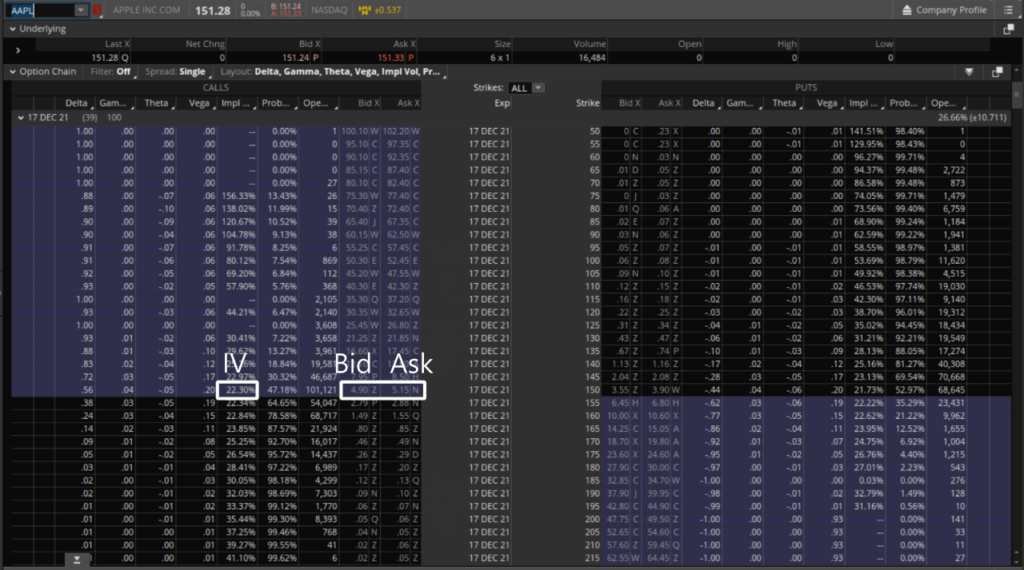
As you may notice, the calculated option price of $5.05 is between the bid price of $4.90 and the ask price of $5.15 shown in Thinkorswim.
So IV and option prices, which comes first?
The Market Maker collects all order flows from brokers, such as TD Ameritrade, Firstrade, Interactive Brokers, then derive ATM option prices based on the increase and decrease of supply and demand for Put and Call options as well as the underlying itself.
Once, you have the ATM options price, you can calculate the IV based on the option pricing model. We have to do some trial and error to approximate the IV value to match the AAPL Call price.
| IV | Call prices |
|---|---|
| 10% | 2.67 |
| 30% | 6.56 |
| 50% | 10.47 |
| 70% | 14.37 |
| 90% | 18.27 |
We see the IV between 10%-30% give results closest to $5.05.
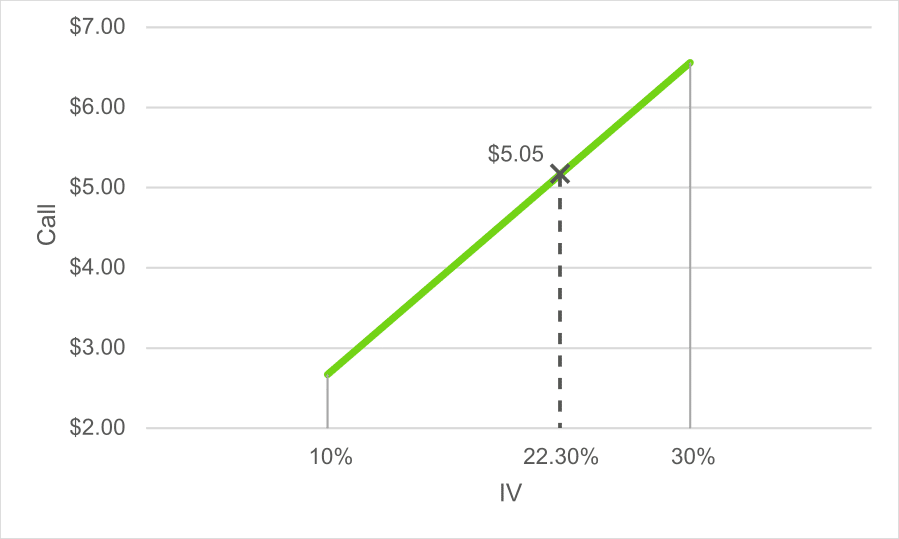
We interpolate the IV between 10% and 30% to find the correct IV as 22.30%, which is the market expectation of future price moves.

Stocks With the Highest IV
| Symbol | IV | IV Perc | IV Rank | Total Options Volume | Call Options Volume | Put Options Volume | Open Interest | Days To/Since Earnings | Earnings Date | ||
|---|---|---|---|---|---|---|---|---|---|---|---|
| AA | 66% | 67% | 49% | 62,161 | 51,608 | 10,553 | 144,374 | 96 | 2026-10-21 | 2026-09-18 | 2026-07-17 |
| AAL | 65% | 84% | 7% | 48,892 | 23,479 | 25,413 | 1,103,781 | 6 | 2026-07-23 | 2026-09-18 | 2026-07-17 |
| AAOI | 143% | 71% | 45% | 55,314 | 28,086 | 27,228 | 203,455 | 13 | 2026-07-30 | 2026-09-18 | 2026-07-17 |
| AAP | 63% | 45% | 23% | 27,572 | 25,289 | 2,283 | 101,348 | 39 | 2026-08-25 | 2026-09-18 | 2026-07-17 |
| AAPL | 29% | 75% | 2% | 1,752,692 | 1,031,867 | 720,825 | 4,414,925 | 13 | 2026-07-30 | 2026-09-18 | 2026-07-17 |
| ABBV | 33% | 82% | 9% | 47,556 | 44,518 | 3,038 | 144,871 | 14 | 2026-07-31 | 2026-09-18 | 2026-07-17 |
| ABNB | 39% | 51% | 31% | 5,087 | 3,129 | 1,958 | 74,995 | 20 | 2026-08-06 | 2026-09-18 | 2026-07-17 |
| ABT | 30% | 73% | 0% | 53,258 | 39,743 | 13,515 | 204,329 | 96 | 2026-10-21 | 2026-09-18 | 2026-07-17 |
| ABVX | 61% | 11% | 99% | 16,795 | 14,978 | 1,817 | 91,810 | 66 | 2026-09-21 | 2026-09-18 | 2026-07-17 |
| ACI | 62% | 86% | 100% | 4,364 | 2,848 | 1,516 | 44,878 | 6 | 2026-07-23 | 2026-09-18 | 2026-07-17 |
| ACN | 66% | 94% | 3% | 17,839 | 8,990 | 8,849 | 146,504 | 76 | 2026-10-01 | 2026-09-18 | 2026-07-17 |
| ADBE | 54% | 84% | 50% | 54,915 | 39,139 | 15,776 | 448,495 | 55 | 2026-09-10 | 2026-09-18 | 2026-07-17 |
| ADEA | 1,349 | 1,225 | 124 | 28,980 | 17 | 2026-08-03 | 2026-09-18 | 2026-07-17 | |||
| ADI | 63% | 98% | 86% | 14,499 | 6,073 | 8,426 | 35,631 | 40 | 2026-08-26 | 2026-09-18 | 2026-07-17 |
| ADM | 1,212 | 828 | 384 | 35,283 | 18 | 2026-08-04 | 2026-09-18 | 2026-07-17 | |||
| ADTN | 1,740 | 1,331 | 409 | 29,489 | 18 | 2026-08-04 | 2026-09-18 | 2026-07-17 | |||
| AEHR | 142% | 54% | 43% | 13,365 | 7,340 | 6,025 | 60,876 | 76 | 2026-10-01 | 2026-09-18 | 2026-07-17 |
| AEM | 51% | 67% | 43% | 6,492 | 3,492 | 3,000 | 59,132 | 12 | 2026-07-29 | 2026-09-18 | 2026-07-17 |
| AEO | 44% | 0% | 0% | 8,516 | 6,807 | 1,709 | 33,246 | 54 | 2026-09-09 | 2026-09-18 | 2026-07-17 |
| AES | 20% | 11% | 98% | 11,995 | 7,038 | 4,957 | 88,428 | 13 | 2026-07-30 | 2026-09-18 | 2026-07-17 |
| AFRM | 56% | 12% | 15% | 20,483 | 11,534 | 8,949 | 112,575 | 34 | 2026-08-20 | 2026-09-18 | 2026-07-17 |
| AG | 72% | 21% | 30% | 76,394 | 39,713 | 36,681 | 724,849 | 13 | 2026-07-30 | 2026-09-18 | 2026-07-17 |
| AGI | 1,478 | 815 | 663 | 38,348 | 12 | 2026-07-29 | 2026-09-18 | 2026-07-17 | |||
| AGNC | 22% | 13% | 23% | 21,015 | 10,391 | 10,624 | 348,006 | 3 | 2026-07-20 | 2026-09-18 | 2026-07-17 |
| AKAM | 80% | 91% | 0% | 3,578 | 1,014 | 2,564 | 38,153 | 20 | 2026-08-06 | 2026-09-18 | 2026-07-17 |
| ALAB | 150% | 100% | 100% | 28,894 | 20,130 | 8,764 | 118,818 | 18 | 2026-08-04 | 2026-09-18 | 2026-07-17 |
| ALB | 62% | 41% | 36% | 12,677 | 2,232 | 10,445 | 79,606 | 19 | 2026-08-05 | 2026-09-18 | 2026-07-17 |
| ALK | 1,299 | 522 | 777 | 60,702 | 4 | 2026-07-21 | 2026-09-18 | 2026-07-17 | |||
| AMAT | 97% | 98% | 0% | 56,913 | 27,490 | 29,423 | 280,819 | 27 | 2026-08-13 | 2026-09-18 | 2026-07-17 |
| AMD | 86% | 99% | 98% | 439,022 | 249,607 | 189,415 | 2,010,913 | 18 | 2026-08-04 | 2026-09-18 | 2026-07-17 |
| AMGN | 40% | 98% | 74% | 7,563 | 5,438 | 2,125 | 59,047 | 18 | 2026-08-04 | 2026-09-18 | 2026-07-17 |
| AMKR | 13,421 | 4,483 | 8,938 | 93,624 | 10 | 2026-07-27 | 2026-09-18 | 2026-07-17 | |||
| AMPX | 107% | 40% | 97% | 31,293 | 8,565 | 22,728 | 233,420 | 19 | 2026-08-05 | 2026-09-18 | 2026-07-17 |
| AMZN | 36% | 71% | 32% | 604,314 | 389,049 | 215,265 | 3,958,674 | 13 | 2026-07-30 | 2026-09-18 | 2026-07-17 |
| ANET | 73% | 88% | 62% | 18,878 | 13,700 | 5,178 | 214,205 | 18 | 2026-08-04 | 2026-09-18 | 2026-07-17 |
| APA | 49% | 46% | 35% | 3,721 | 2,554 | 1,167 | 61,548 | 20 | 2026-08-06 | 2026-09-18 | 2026-07-17 |
| APH | 4,342 | 967 | 3,375 | 72,457 | 12 | 2026-07-29 | 2026-09-18 | 2026-07-17 | |||
| APLD | 108% | 46% | 39% | 77,044 | 58,597 | 18,447 | 658,685 | 10 | 2026-07-27 | 2026-09-18 | 2026-07-17 |
| APO | 47% | 64% | 44% | 3,268 | 2,261 | 1,007 | 74,657 | 18 | 2026-08-04 | 2026-09-18 | 2026-07-17 |
| APP | 88% | 84% | 47% | 22,156 | 8,552 | 13,604 | 110,615 | 19 | 2026-08-05 | 2026-09-18 | 2026-07-17 |
| AR | 43% | 39% | 22% | 2,942 | 1,313 | 1,629 | 115,370 | 12 | 2026-07-29 | 2026-09-18 | 2026-07-17 |
| ARCC | 2,318 | 1,509 | 809 | 87,910 | 12 | 2026-07-29 | 2026-09-18 | 2026-07-17 | |||
| ARM | 109% | 94% | 76% | 90,857 | 36,387 | 54,470 | 455,419 | 12 | 2026-07-29 | 2026-09-18 | 2026-07-17 |
| ASML | 59% | 84% | 60% | 24,221 | 10,582 | 13,639 | 83,356 | 89 | 2026-10-14 | 2026-09-18 | 2026-07-17 |
| ASST | 132% | 82% | 92% | 13,243 | 4,254 | 8,989 | 484,523 | 47 | 2026-09-02 | 2026-09-18 | 2026-07-17 |
| ASTS | 116% | 73% | 56% | 389,412 | 182,204 | 207,208 | 1,139,586 | 31 | 2026-08-17 | 2026-09-18 | 2026-07-17 |
| ASX | 49,212 | 48,058 | 1,154 | 79,965 | 6 | 2026-07-23 | 2026-09-18 | 2026-07-17 | |||
| AVAV | 69% | 37% | 98% | 11,279 | 8,001 | 3,278 | 39,773 | 54 | 2026-09-09 | 2026-09-18 | 2026-07-17 |
| AVGO | 49% | 57% | 30% | 275,678 | 187,438 | 88,240 | 1,561,502 | 48 | 2026-09-03 | 2026-09-18 | 2026-07-17 |
| AXP | 37% | 82% | 59% | 17,053 | 4,499 | 12,554 | 150,993 | 7 | 2026-07-24 | 2026-09-18 | 2026-07-17 |
| AXTI | 178% | 65% | 0% | 32,172 | 26,276 | 5,896 | 145,893 | 13 | 2026-07-30 | 2026-09-18 | 2026-07-17 |
| B | 41% | 25% | 99% | 22,257 | 9,537 | 12,720 | 472,977 | 24 | 2026-08-10 | 2026-09-18 | 2026-07-17 |
| BA | 36% | 66% | 67% | 46,537 | 29,570 | 16,967 | 527,893 | 11 | 2026-07-28 | 2026-09-18 | 2026-07-17 |
| BABA | 46% | 59% | 46% | 138,908 | 83,789 | 55,119 | 1,535,371 | 42 | 2026-08-28 | 2026-09-18 | 2026-07-17 |
| BAC | 21% | 12% | 0% | 106,577 | 64,585 | 41,992 | 1,462,455 | 89 | 2026-10-14 | 2026-09-18 | 2026-07-17 |
| BAX | 57% | 69% | 38% | 3,750 | 3,385 | 365 | 44,652 | 13 | 2026-07-30 | 2026-09-18 | 2026-07-17 |
| BBY | 34% | 16% | 100% | 3,625 | 2,239 | 1,386 | 38,154 | 46 | 2026-09-01 | 2026-09-18 | 2026-07-17 |
| BE | 169% | 99% | 87% | 244,476 | 124,567 | 119,909 | 865,142 | 11 | 2026-07-28 | 2026-09-18 | 2026-07-17 |
| BHVN | 11,440 | 7,362 | 4,078 | 51,600 | 17 | 2026-08-03 | 2026-09-18 | 2026-07-17 | |||
| BIDU | 51% | 47% | 41% | 38,879 | 31,505 | 7,374 | 190,681 | 40 | 2026-08-26 | 2026-09-18 | 2026-07-17 |
| BILI | 57% | 29% | 33% | 2,541 | 1,395 | 1,146 | 68,735 | 27 | 2026-08-13 | 2026-09-18 | 2026-07-17 |
| BKNG | 42% | 68% | 39% | 6,413 | 3,757 | 2,656 | 111,386 | 18 | 2026-08-04 | 2026-09-18 | 2026-07-17 |
| BKR | 3,103 | 890 | 2,213 | 39,144 | 9 | 2026-07-26 | 2026-09-18 | 2026-07-17 | |||
| BKSY | 3,184 | 2,220 | 964 | 29,493 | 26 | 2026-08-12 | 2026-09-18 | 2026-07-17 | |||
| BMNR | 68% | 2% | 5% | 78,254 | 59,600 | 18,654 | 1,152,762 | 126 | 2026-11-20 | 2026-09-18 | 2026-07-17 |
| BMY | 36% | 77% | 44% | 49,699 | 42,545 | 7,154 | 401,641 | 13 | 2026-07-30 | 2026-09-18 | 2026-07-17 |
| BNY | 3,636 | 1,832 | 1,804 | 36,820 | 90 | 2026-10-15 | 2026-09-18 | 2026-07-17 | |||
| BP | 35% | 74% | 10% | 39,598 | 36,482 | 3,116 | 223,235 | 18 | 2026-08-04 | 2026-09-18 | 2026-07-17 |
| BRK-B | 15% | 44% | 44% | 28,781 | 22,210 | 6,571 | 305,351 | 2026-09-18 | 2026-07-17 | ||
| BRUN | 155% | 31% | 27% | 9,217 | 1,310 | 7,907 | 51,549 | 47 | 2026-09-02 | 2026-09-18 | 2026-07-17 |
| BSX | 58% | 97% | 76% | 118,183 | 71,693 | 46,490 | 677,337 | 12 | 2026-07-29 | 2026-09-18 | 2026-07-17 |
| BTDR | 127% | 59% | 1% | 40,200 | 22,416 | 17,784 | 385,997 | 21 | 2026-08-07 | 2026-09-18 | 2026-07-17 |
| BTI | 6,234 | 5,452 | 782 | 72,017 | 13 | 2026-07-30 | 2026-09-18 | 2026-07-17 | |||
| BTU | 60% | 22% | 23% | 8,219 | 4,567 | 3,652 | 43,702 | 13 | 2026-07-30 | 2026-09-18 | 2026-07-17 |
| BW | 142% | 64% | 98% | 2,014 | 1,295 | 719 | 30,689 | 20 | 2026-08-06 | 2026-09-18 | 2026-07-17 |
| BX | 43% | 61% | 94% | 7,834 | 4,290 | 3,544 | 206,129 | 6 | 2026-07-23 | 2026-09-18 | 2026-07-17 |
| C | 31% | 49% | 0% | 72,949 | 37,702 | 35,247 | 710,650 | 88 | 2026-10-13 | 2026-09-18 | 2026-07-17 |
| CAG | 33% | 33% | 45% | 14,014 | 10,447 | 3,567 | 185,237 | 76 | 2026-10-01 | 2026-09-18 | 2026-07-17 |
| CAPR | 7,529 | 984 | 6,545 | 73,660 | 26 | 2026-08-12 | 2026-09-18 | 2026-07-17 | |||
| CART | 67% | 87% | 34% | 5,275 | 4,237 | 1,038 | 44,801 | 20 | 2026-08-06 | 2026-09-18 | 2026-07-17 |
| CAT | 54% | 98% | 89% | 39,317 | 17,632 | 21,685 | 153,324 | 18 | 2026-08-04 | 2026-09-18 | 2026-07-17 |
| CAVA | 62% | 55% | 28% | 10,393 | 6,005 | 4,388 | 76,508 | 32 | 2026-08-18 | 2026-09-18 | 2026-07-17 |
| CBRS | 108% | 35% | 20% | 60,881 | 53,540 | 7,341 | 118,621 | 47 | 2026-09-02 | 2026-09-18 | 2026-07-17 |
| CC | 81% | 54% | 100% | 1,878 | 1,211 | 667 | 60,927 | 6 | 2026-07-23 | 2026-09-18 | 2026-07-17 |
| CCJ | 59% | 55% | 31% | 22,681 | 13,578 | 9,103 | 300,821 | 14 | 2026-07-31 | 2026-09-18 | 2026-07-17 |
| CCL | 40% | 25% | 0% | 70,296 | 14,350 | 55,946 | 617,885 | 62 | 2026-09-17 | 2026-09-18 | 2026-07-17 |
| CDE | 72% | 20% | 5% | 19,413 | 14,374 | 5,039 | 350,020 | 19 | 2026-08-05 | 2026-09-18 | 2026-07-17 |
| CDNS | 60% | 90% | 48% | 2,725 | 1,116 | 1,609 | 47,302 | 10 | 2026-07-27 | 2026-09-18 | 2026-07-17 |
| CEG | 52% | 49% | 37% | 9,246 | 4,606 | 4,640 | 114,068 | 20 | 2026-08-06 | 2026-09-18 | 2026-07-17 |
| CELH | 63% | 56% | 29% | 28,344 | 22,577 | 5,767 | 383,131 | 25 | 2026-08-11 | 2026-09-18 | 2026-07-17 |
| CF | 52% | 65% | 37% | 3,329 | 2,398 | 931 | 38,049 | 19 | 2026-08-05 | 2026-09-18 | 2026-07-17 |
| CG | 582 | 311 | 271 | 239,094 | 19 | 2026-08-05 | 2026-09-18 | 2026-07-17 | |||
| CGON | 1,258 | 1,211 | 47 | 29,942 | 21 | 2026-08-07 | 2026-09-18 | 2026-07-17 | |||
| CHTR | 101% | 98% | 81% | 4,444 | 2,419 | 2,025 | 66,858 | 7 | 2026-07-24 | 2026-09-18 | 2026-07-17 |
| CHWY | 59% | 72% | 41% | 8,937 | 5,623 | 3,314 | 163,043 | 47 | 2026-09-02 | 2026-09-18 | 2026-07-17 |
| CI | 37% | 65% | 0% | 3,701 | 1,797 | 1,904 | 30,460 | 13 | 2026-07-30 | 2026-09-18 | 2026-07-17 |
| CIEN | 119% | 93% | 100% | 15,887 | 7,388 | 8,499 | 54,234 | 48 | 2026-09-03 | 2026-09-18 | 2026-07-17 |
| CIFR | 112% | 38% | 29% | 105,925 | 89,412 | 16,513 | 1,009,289 | 25 | 2026-08-11 | 2026-09-18 | 2026-07-17 |
| CL | 31% | 84% | 100% | 3,463 | 2,511 | 952 | 30,411 | 14 | 2026-07-31 | 2026-09-18 | 2026-07-17 |
| CLMT | 6,326 | 5,181 | 1,145 | 30,819 | 21 | 2026-08-07 | 2026-09-18 | 2026-07-17 | |||
| CLS | 96% | 90% | 63% | 9,601 | 4,820 | 4,781 | 65,050 | 10 | 2026-07-27 | 2026-09-18 | 2026-07-17 |
| CLSK | 96% | 46% | 86% | 67,640 | 55,144 | 12,496 | 586,276 | 25 | 2026-08-11 | 2026-09-18 | 2026-07-17 |
| CLX | 8,024 | 2,504 | 5,520 | 72,204 | 17 | 2026-08-03 | 2026-09-18 | 2026-07-17 | |||
| CMCSA | 57% | 96% | 3% | 58,669 | 38,956 | 19,713 | 550,793 | 6 | 2026-07-23 | 2026-09-18 | 2026-07-17 |
| CMG | 54% | 88% | 5% | 27,149 | 14,639 | 12,510 | 394,955 | 12 | 2026-07-29 | 2026-09-18 | 2026-07-17 |
| CMPS | 9,153 | 5,823 | 3,330 | 121,763 | 13 | 2026-07-30 | 2026-09-18 | 2026-07-17 | |||
| CNC | 61% | 75% | 0% | 5,566 | 4,168 | 1,398 | 66,370 | 11 | 2026-07-28 | 2026-09-18 | 2026-07-17 |
| CNQ | 29% | 24% | 99% | 3,161 | 2,195 | 966 | 28,948 | 13 | 2026-07-30 | 2026-09-18 | 2026-07-17 |
| CODI | 105 | 82 | 23 | 43,784 | 19 | 2026-08-05 | 2026-09-18 | 2026-07-17 | |||
| COF | 38% | 66% | 68% | 6,906 | 4,068 | 2,838 | 93,881 | 4 | 2026-07-21 | 2026-09-18 | 2026-07-17 |
| COHR | 114% | 94% | 75% | 29,358 | 11,881 | 17,477 | 123,022 | 27 | 2026-08-13 | 2026-09-18 | 2026-07-17 |
| COIN | 85% | 95% | 60% | 78,215 | 43,349 | 34,866 | 683,350 | 13 | 2026-07-30 | 2026-09-18 | 2026-07-17 |
| COMP | 8,441 | 8,066 | 375 | 86,234 | 24 | 2026-08-10 | 2026-09-18 | 2026-07-17 | |||
| COP | 33% | 51% | 34% | 12,105 | 6,436 | 5,669 | 139,199 | 20 | 2026-08-06 | 2026-09-18 | 2026-07-17 |
| COPX | 41% | 23% | 97% | 12,676 | 6,669 | 6,007 | 123,977 | 2026-09-18 | 2026-07-17 | ||
| CORZ | 105% | 84% | 1% | 35,004 | 22,120 | 12,884 | 899,018 | 20 | 2026-08-06 | 2026-09-18 | 2026-07-17 |
| COST | 24% | 64% | 37% | 66,670 | 31,978 | 34,692 | 204,857 | 69 | 2026-09-24 | 2026-09-18 | 2026-07-17 |
| CPB | 36% | 50% | 100% | 9,291 | 5,849 | 3,442 | 111,750 | 41 | 2026-08-27 | 2026-09-18 | 2026-07-17 |
| CPNG | 69% | 92% | 100% | 11,133 | 5,123 | 6,010 | 351,499 | 25 | 2026-08-11 | 2026-09-18 | 2026-07-17 |
| CPRT | 11,432 | 10,378 | 1,054 | 31,061 | 54 | 2026-09-09 | 2026-09-18 | 2026-07-17 | |||
| CRCL | 94% | 72% | 48% | 69,918 | 37,887 | 32,031 | 500,242 | 32 | 2026-08-18 | 2026-09-18 | 2026-07-17 |
| CRDO | 115% | 81% | 56% | 21,107 | 11,943 | 9,164 | 127,762 | 54 | 2026-09-09 | 2026-09-18 | 2026-07-17 |
| CRM | 48% | 70% | 96% | 62,369 | 39,711 | 22,658 | 763,772 | 47 | 2026-09-02 | 2026-09-18 | 2026-07-17 |
| CRSP | 81% | 87% | 61% | 4,623 | 2,616 | 2,007 | 35,354 | 24 | 2026-08-10 | 2026-09-18 | 2026-07-17 |
| CRWD | 63% | 89% | 50% | 62,403 | 32,349 | 30,054 | 567,593 | 47 | 2026-09-02 | 2026-09-18 | 2026-07-17 |
| CRWV | 95% | 57% | 29% | 299,616 | 126,740 | 172,876 | 1,668,322 | 32 | 2026-08-18 | 2026-09-18 | 2026-07-17 |
| CSCO | 42% | 88% | 97% | 77,708 | 33,887 | 43,821 | 650,057 | 33 | 2026-08-19 | 2026-09-18 | 2026-07-17 |
| CSIQ | 117% | 81% | 74% | 5,171 | 3,258 | 1,913 | 32,040 | 34 | 2026-08-20 | 2026-09-18 | 2026-07-17 |
| CSX | 30% | 52% | 9% | 16,275 | 15,575 | 700 | 107,003 | 5 | 2026-07-22 | 2026-09-18 | 2026-07-17 |
| CTSH | 7,399 | 1,819 | 5,580 | 47,383 | 12 | 2026-07-29 | 2026-09-18 | 2026-07-17 | |||
| CVE | 1,880 | 1,662 | 218 | 28,244 | 6 | 2026-07-23 | 2026-09-18 | 2026-07-17 | |||
| CVNA | 87% | 86% | 44% | 33,192 | 17,572 | 15,620 | 627,082 | 12 | 2026-07-29 | 2026-09-18 | 2026-07-17 |
| CVS | 35% | 61% | 30% | 18,663 | 9,589 | 9,074 | 159,956 | 19 | 2026-08-05 | 2026-09-18 | 2026-07-17 |
| CVX | 29% | 59% | 30% | 34,389 | 26,005 | 8,384 | 373,402 | 14 | 2026-07-31 | 2026-09-18 | 2026-07-17 |
| CXW | 29,371 | 24,215 | 5,156 | 68,137 | 19 | 2026-08-05 | 2026-09-18 | 2026-07-17 | |||
| CYTK | 5,102 | 4,852 | 250 | 46,136 | 13 | 2026-07-30 | 2026-09-18 | 2026-07-17 | |||
| CZR | 27% | 8% | 0% | 7,800 | 7,742 | 58 | 145,596 | 11 | 2026-07-28 | 2026-09-18 | 2026-07-17 |
| DAL | 37% | 11% | 100% | 16,617 | 8,813 | 7,804 | 254,046 | 83 | 2026-10-08 | 2026-09-18 | 2026-07-17 |
| DASH | 62% | 75% | 39% | 11,090 | 6,551 | 4,539 | 56,086 | 19 | 2026-08-05 | 2026-09-18 | 2026-07-17 |
| DAX | 0 | 0 | 0 | 0 | 2026-09-18 | 2026-07-17 | |||||
| DDOG | 74% | 84% | 47% | 8,532 | 5,189 | 3,343 | 77,190 | 20 | 2026-08-06 | 2026-09-18 | 2026-07-17 |
| DEI | 2,823 | 2,810 | 13 | 28,101 | 18 | 2026-08-04 | 2026-09-18 | 2026-07-17 | |||
| DELL | 85% | 91% | 66% | 60,629 | 31,791 | 28,838 | 315,479 | 48 | 2026-09-03 | 2026-09-18 | 2026-07-17 |
| DFTX | 4,907 | 2,143 | 2,764 | 45,272 | 20 | 2026-08-06 | 2026-09-18 | 2026-07-17 | |||
| DG | 44% | 70% | 36% | 8,997 | 5,295 | 3,702 | 42,983 | 41 | 2026-08-27 | 2026-09-18 | 2026-07-17 |
| DHR | 51% | 96% | 0% | 6,290 | 4,422 | 1,868 | 42,139 | 4 | 2026-07-21 | 2026-09-18 | 2026-07-17 |
| DHT | 18,544 | 18,134 | 410 | 64,777 | 26 | 2026-08-12 | 2026-09-18 | 2026-07-17 | |||
| DIA | 12% | 17% | 15% | 59,981 | 30,061 | 29,920 | 266,187 | 2026-09-18 | 2026-07-17 | ||
| DINO | 12,858 | 12,626 | 232 | 47,941 | 11 | 2026-07-28 | 2026-09-18 | 2026-07-17 | |||
| DIS | 31% | 71% | 99% | 64,787 | 41,314 | 23,473 | 503,893 | 19 | 2026-08-05 | 2026-09-18 | 2026-07-17 |
| DKNG | 56% | 50% | 1% | 32,257 | 24,061 | 8,196 | 473,215 | 20 | 2026-08-06 | 2026-09-18 | 2026-07-17 |
| DLO | 2,273 | 2,218 | 55 | 122,726 | 27 | 2026-08-13 | 2026-09-18 | 2026-07-17 | |||
| DOCN | 106% | 78% | 10% | 9,270 | 1,666 | 7,604 | 38,417 | 26 | 2026-08-12 | 2026-09-18 | 2026-07-17 |
| DOCU | 64% | 73% | 0% | 14,989 | 10,798 | 4,191 | 47,248 | 48 | 2026-09-03 | 2026-09-18 | 2026-07-17 |
| DOW | 51% | 51% | 40% | 10,045 | 7,282 | 2,763 | 257,296 | 6 | 2026-07-23 | 2026-09-18 | 2026-07-17 |
| DUK | 1,632 | 1,159 | 473 | 47,093 | 18 | 2026-08-04 | 2026-09-18 | 2026-07-17 | |||
| DUOL | 79% | 66% | 26% | 2,694 | 1,555 | 1,139 | 30,095 | 19 | 2026-08-05 | 2026-09-18 | 2026-07-17 |
| DVN | 43% | 75% | 99% | 13,726 | 7,070 | 6,656 | 348,595 | 18 | 2026-08-04 | 2026-09-18 | 2026-07-17 |
| DXCM | 51% | 57% | 34% | 4,477 | 3,596 | 881 | 33,311 | 13 | 2026-07-30 | 2026-09-18 | 2026-07-17 |
| DXJ | 19 | 6 | 13 | 21 | 2026-09-18 | 2026-07-17 | |||||
| EA | 11% | 15% | 100% | 1,078 | 813 | 265 | 38,439 | 18 | 2026-08-04 | 2026-09-18 | 2026-07-17 |
| EBAY | 40% | 56% | 1% | 15,283 | 2,577 | 12,706 | 44,225 | 19 | 2026-08-05 | 2026-09-18 | 2026-07-17 |
| EC | 6,496 | 5,744 | 752 | 49,896 | 17 | 2026-08-03 | 2026-09-18 | 2026-07-17 | |||
| ECHO | 61% | 31% | 31% | 79,820 | 43,315 | 36,505 | 286,926 | 13 | 2026-07-30 | 2026-09-18 | 2026-07-17 |
| EEM | 41% | 92% | 0% | 62,392 | 10,554 | 51,838 | 1,514,386 | 2026-09-18 | 2026-07-17 | ||
| EFA | 17% | 51% | 99% | 17,529 | 8,480 | 9,049 | 313,937 | 2026-09-18 | 2026-07-17 | ||
| EIDO | 139 | 7 | 132 | 0 | 2026-09-18 | 2026-07-17 | |||||
| EL | 45% | 38% | 25% | 944 | 460 | 484 | 46,896 | 33 | 2026-08-19 | 2026-09-18 | 2026-07-17 |
| ELF | 78% | 73% | 37% | 7,587 | 5,891 | 1,696 | 68,851 | 26 | 2026-08-12 | 2026-09-18 | 2026-07-17 |
| ENB | 4,442 | 2,441 | 2,001 | 34,718 | 14 | 2026-07-31 | 2026-09-18 | 2026-07-17 | |||
| ENPH | 109% | 94% | 71% | 26,343 | 10,382 | 15,961 | 213,605 | 11 | 2026-07-28 | 2026-09-18 | 2026-07-17 |
| EOG | 33% | 47% | 26% | 14,789 | 13,565 | 1,224 | 50,720 | 18 | 2026-08-04 | 2026-09-18 | 2026-07-17 |
| EPD | 28% | 88% | 0% | 2,886 | 2,438 | 448 | 117,570 | 13 | 2026-07-30 | 2026-09-18 | 2026-07-17 |
| EQNR | 977 | 327 | 650 | 29,982 | 5 | 2026-07-22 | 2026-09-18 | 2026-07-17 | |||
| EQPT | 748 | 651 | 97 | 49,007 | 47 | 2026-09-02 | 2026-09-18 | 2026-07-17 | |||
| EQT | 35% | 33% | 100% | 8,468 | 3,597 | 4,871 | 160,238 | 4 | 2026-07-21 | 2026-09-18 | 2026-07-17 |
| ERAS | 822 | 394 | 428 | 65,906 | 20 | 2026-08-06 | 2026-09-18 | 2026-07-17 | |||
| ERO | 3,063 | 2,226 | 837 | 54,207 | 19 | 2026-08-05 | 2026-09-18 | 2026-07-17 | |||
| ESTC | 853 | 167 | 686 | 29,427 | 41 | 2026-08-27 | 2026-09-18 | 2026-07-17 | |||
| ET | 26% | 64% | 0% | 52,520 | 50,260 | 2,260 | 687,778 | 18 | 2026-08-04 | 2026-09-18 | 2026-07-17 |
| ETN | 57% | 97% | 64% | 2,647 | 1,515 | 1,132 | 37,575 | 14 | 2026-07-31 | 2026-09-18 | 2026-07-17 |
| ETSY | 61% | 57% | 13% | 6,838 | 3,970 | 2,868 | 46,700 | 19 | 2026-08-05 | 2026-09-18 | 2026-07-17 |
| EWJ | 22% | 38% | 27% | 3,039 | 1,153 | 1,886 | 40,343 | 2026-09-18 | 2026-07-17 | ||
| EWM | 5 | 4 | 1 | 97 | 2026-09-18 | 2026-07-17 | |||||
| EWS | 7 | 7 | 0 | 83 | 2026-09-18 | 2026-07-17 | |||||
| EWT | 7,255 | 6,620 | 635 | 66,563 | 2026-09-18 | 2026-07-17 | |||||
| EWW | 23 | 13 | 10 | 120 | 2026-09-18 | 2026-07-17 | |||||
| EWY | 88% | 89% | 71% | 117,746 | 24,601 | 93,145 | 890,050 | 2026-09-18 | 2026-07-17 | ||
| EWZ | 26% | 24% | 10% | 92,372 | 46,035 | 46,337 | 2,868,089 | 2026-09-18 | 2026-07-17 | ||
| EXE | 2,480 | 1,319 | 1,161 | 159,429 | 11 | 2026-07-28 | 2026-09-18 | 2026-07-17 | |||
| EZA | 51 | 0 | 51 | 32 | 2026-09-18 | 2026-07-17 | |||||
| F | 45% | 76% | 0% | 74,932 | 30,308 | 44,624 | 1,278,371 | 11 | 2026-07-28 | 2026-09-18 | 2026-07-17 |
| FAST | 3,253 | 1,302 | 1,951 | 43,357 | 89 | 2026-10-14 | 2026-09-18 | 2026-07-17 | |||
| FCEL | 139% | 12% | 17% | 18,212 | 8,694 | 9,518 | 144,610 | 53 | 2026-09-08 | 2026-09-18 | 2026-07-17 |
| FCX | 60% | 87% | 75% | 51,164 | 22,580 | 28,584 | 752,347 | 6 | 2026-07-23 | 2026-09-18 | 2026-07-17 |
| FIG | 101% | 74% | 100% | 180,560 | 164,549 | 16,011 | 474,273 | 19 | 2026-08-05 | 2026-09-18 | 2026-07-17 |
| FIGR | 88% | 17% | 31% | 2,131 | 1,742 | 389 | 31,088 | 27 | 2026-08-13 | 2026-09-18 | 2026-07-17 |
| FISV | 49% | 45% | 100% | 28,711 | 9,421 | 19,290 | 185,600 | 20 | 2026-08-06 | 2026-09-18 | 2026-07-17 |
| FITB | 7,251 | 5,500 | 1,751 | 42,565 | 0 | 2026-07-17 | 2026-09-18 | 2026-07-17 | |||
| FIVN | 7,399 | 7,252 | 147 | 83,756 | 12 | 2026-07-29 | 2026-09-18 | 2026-07-17 | |||
| FLEX | 12,504 | 4,202 | 8,302 | 38,595 | 12 | 2026-07-29 | 2026-09-18 | 2026-07-17 | |||
| FLG | 16,619 | 16,119 | 500 | 159,779 | 7 | 2026-07-24 | 2026-09-18 | 2026-07-17 | |||
| FLNC | 18,118 | 8,125 | 9,993 | 169,126 | 31 | 2026-08-17 | 2026-09-18 | 2026-07-17 | |||
| FLR | 664 | 471 | 193 | 61,683 | 21 | 2026-08-07 | 2026-09-18 | 2026-07-17 | |||
| FLUT | 1,303 | 411 | 892 | 32,424 | 20 | 2026-08-06 | 2026-09-18 | 2026-07-17 | |||
| FLY | 113% | 35% | 26% | 9,353 | 5,660 | 3,693 | 88,825 | 25 | 2026-08-11 | 2026-09-18 | 2026-07-17 |
| FMC | 2,932 | 1,774 | 1,158 | 41,221 | 12 | 2026-07-29 | 2026-09-18 | 2026-07-17 | |||
| FND | 2,995 | 2,892 | 103 | 29,182 | 13 | 2026-07-30 | 2026-09-18 | 2026-07-17 | |||
| FOUR | 1,819 | 1,646 | 173 | 31,542 | 13 | 2026-07-30 | 2026-09-18 | 2026-07-17 | |||
| FOXA | 4,705 | 2,246 | 2,459 | 38,546 | 25 | 2026-08-11 | 2026-09-18 | 2026-07-17 | |||
| FPS | 4,296 | 1,445 | 2,851 | 43,772 | 47 | 2026-09-02 | 2026-09-18 | 2026-07-17 | |||
| FRO | 11,580 | 11,431 | 149 | 60,592 | 45 | 2026-08-31 | 2026-09-18 | 2026-07-17 | |||
| FROG | 468 | 319 | 149 | 55,621 | 20 | 2026-08-06 | 2026-09-18 | 2026-07-17 | |||
| FSLR | 72% | 84% | 55% | 13,121 | 8,136 | 4,985 | 291,448 | 6 | 2026-07-23 | 2026-09-18 | 2026-07-17 |
| FSLY | 101% | 64% | 38% | 4,956 | 2,899 | 2,057 | 79,427 | 19 | 2026-08-05 | 2026-09-18 | 2026-07-17 |
| FTNT | 80% | 96% | 88% | 6,465 | 3,192 | 3,273 | 81,195 | 12 | 2026-07-29 | 2026-09-18 | 2026-07-17 |
| FUBO | 88% | 11% | 88% | 4,839 | 4,335 | 504 | 59,391 | 25 | 2026-08-11 | 2026-09-18 | 2026-07-17 |
| FUTU | 58% | 51% | 36% | 3,942 | 1,696 | 2,246 | 46,645 | 40 | 2026-08-26 | 2026-09-18 | 2026-07-17 |
| FXE | 501 | 50 | 451 | 19,849 | 2026-09-18 | 2026-07-17 | |||||
| FXI | 28% | 76% | 15% | 275,150 | 75,697 | 199,453 | 1,561,300 | 2026-09-18 | 2026-07-17 | ||
| GAP | 46% | 39% | 17% | 5,793 | 1,567 | 4,226 | 91,168 | 34 | 2026-08-20 | 2026-09-18 | 2026-07-17 |
| GDS | 1,373 | 944 | 429 | 42,811 | 40 | 2026-08-26 | 2026-09-18 | 2026-07-17 | |||
| GDX | 42% | 33% | 36% | 339,065 | 161,468 | 177,597 | 1,345,999 | 2026-09-18 | 2026-07-17 | ||
| GDXJ | 53% | 41% | 30% | 12,674 | 4,033 | 8,641 | 42,349 | 2026-09-18 | 2026-07-17 | ||
| GE | 37% | 65% | 40% | 36,453 | 16,920 | 19,533 | 182,466 | -1 | 2026-07-16 | 2026-09-18 | 2026-07-17 |
| GEO | 44,234 | 43,924 | 310 | 70,728 | 20 | 2026-08-06 | 2026-09-18 | 2026-07-17 | |||
| GEV | 74% | 99% | 94% | 18,698 | 6,299 | 12,399 | 94,811 | 5 | 2026-07-22 | 2026-09-18 | 2026-07-17 |
| GFS | 10,697 | 3,644 | 7,053 | 64,312 | 19 | 2026-08-05 | 2026-09-18 | 2026-07-17 | |||
| GILD | 40% | 88% | 52% | 8,919 | 6,554 | 2,365 | 97,767 | 20 | 2026-08-06 | 2026-09-18 | 2026-07-17 |
| GIS | 20,361 | 16,474 | 3,887 | 189,335 | 68 | 2026-09-23 | 2026-09-18 | 2026-07-17 | |||
| GLD | 22% | 59% | 29% | 294,079 | 76,336 | 217,743 | 2,361,330 | 2026-09-18 | 2026-07-17 | ||
| GLW | 96% | 96% | 16% | 113,466 | 42,674 | 70,792 | 422,389 | 11 | 2026-07-28 | 2026-09-18 | 2026-07-17 |
| GLXY | 120% | 91% | 20% | 17,311 | 12,574 | 4,737 | 254,385 | 25 | 2026-08-11 | 2026-09-18 | 2026-07-17 |
| GM | 45% | 88% | 100% | 10,292 | 6,559 | 3,733 | 132,478 | 4 | 2026-07-21 | 2026-09-18 | 2026-07-17 |
| GME | 30% | 3% | 10% | 114,445 | 90,254 | 24,191 | 1,214,784 | 54 | 2026-09-09 | 2026-09-18 | 2026-07-17 |
| GOOG | 47% | 94% | 59% | 256,123 | 156,935 | 99,188 | 1,255,101 | 5 | 2026-07-22 | 2026-09-18 | 2026-07-17 |
| GOOGL | 50% | 96% | 72% | 560,257 | 345,271 | 214,986 | 2,243,587 | 5 | 2026-07-22 | 2026-09-18 | 2026-07-17 |
| GRPN | 19,187 | 17,437 | 1,750 | 76,254 | 26 | 2026-08-12 | 2026-09-18 | 2026-07-17 | |||
| GRRR | 165% | 96% | 8% | 12,579 | 5,935 | 6,644 | 80,080 | 82 | 2026-10-07 | 2026-09-18 | 2026-07-17 |
| GS | 33% | 62% | 45% | 56,252 | 25,701 | 30,551 | 217,630 | 88 | 2026-10-13 | 2026-09-18 | 2026-07-17 |
| GSK | 31% | 40% | 1% | 1,114 | 365 | 749 | 29,127 | 11 | 2026-07-28 | 2026-09-18 | 2026-07-17 |
| GTLB | 71% | 47% | 23% | 6,579 | 5,531 | 1,048 | 60,194 | 53 | 2026-09-08 | 2026-09-18 | 2026-07-17 |
| HAL | 49% | 93% | 76% | 11,796 | 8,819 | 2,977 | 174,329 | 4 | 2026-07-21 | 2026-09-18 | 2026-07-17 |
| HBAN | 2,873 | 2,512 | 361 | 33,718 | 6 | 2026-07-23 | 2026-09-18 | 2026-07-17 | |||
| HD | 29% | 57% | 0% | 11,668 | 7,597 | 4,071 | 149,841 | 32 | 2026-08-18 | 2026-09-18 | 2026-07-17 |
| HE | 4,732 | 4,677 | 55 | 72,560 | 21 | 2026-08-07 | 2026-09-18 | 2026-07-17 | |||
| HIMS | 111% | 88% | 56% | 98,408 | 54,238 | 44,170 | 712,210 | 24 | 2026-08-10 | 2026-09-18 | 2026-07-17 |
| HIMX | 2,879 | 2,380 | 499 | 50,149 | 20 | 2026-08-06 | 2026-09-18 | 2026-07-17 | |||
| HL | 84% | 59% | 51% | 31,575 | 23,198 | 8,377 | 497,967 | 25 | 2026-08-11 | 2026-09-18 | 2026-07-17 |
| HMY | 366 | 295 | 71 | 31,562 | 41 | 2026-08-27 | 2026-09-18 | 2026-07-17 | |||
| HON | 37% | 86% | 49% | 2,295 | 1,641 | 654 | 50,158 | 6 | 2026-07-23 | 2026-09-18 | 2026-07-17 |
| HOOD | 83% | 94% | 65% | 302,249 | 210,558 | 91,691 | 1,445,537 | 12 | 2026-07-29 | 2026-09-18 | 2026-07-17 |
| HPE | 79% | 94% | 89% | 33,697 | 25,909 | 7,788 | 275,138 | 46 | 2026-09-01 | 2026-09-18 | 2026-07-17 |
| HPQ | 46% | 59% | 1% | 11,991 | 5,349 | 6,642 | 208,033 | 46 | 2026-09-01 | 2026-09-18 | 2026-07-17 |
| HSAI | 591 | 442 | 149 | 29,193 | 33 | 2026-08-19 | 2026-09-18 | 2026-07-17 | |||
| HUM | 68% | 89% | 58% | 8,645 | 3,065 | 5,580 | 31,498 | 12 | 2026-07-29 | 2026-09-18 | 2026-07-17 |
| HUT | 110% | 55% | 24% | 28,074 | 14,833 | 13,241 | 113,007 | 18 | 2026-08-04 | 2026-09-18 | 2026-07-17 |
| HYMC | 7,308 | 3,976 | 3,332 | 35,222 | 12 | 2026-07-29 | 2026-09-18 | 2026-07-17 | |||
| IBKR | 53% | 88% | 66% | 3,893 | 1,972 | 1,921 | 38,629 | 4 | 2026-07-21 | 2026-09-18 | 2026-07-17 |
| IBM | 52% | 89% | 45% | 321,295 | 201,241 | 120,054 | 709,819 | 96 | 2026-10-21 | 2026-09-18 | 2026-07-17 |
| ICE | 36% | 82% | 95% | 2,010 | 1,652 | 358 | 28,302 | 13 | 2026-07-30 | 2026-09-18 | 2026-07-17 |
| IEF | 6% | 27% | 100% | 9,413 | 2,807 | 6,606 | 184,784 | 2026-09-18 | 2026-07-17 | ||
| INDA | 297 | 200 | 97 | 13,724 | 2026-09-18 | 2026-07-17 | |||||
| INFY | 12,076 | 9,460 | 2,616 | 94,018 | 6 | 2026-07-23 | 2026-09-18 | 2026-07-17 | |||
| INSM | 2,961 | 2,405 | 556 | 28,375 | 13 | 2026-07-30 | 2026-09-18 | 2026-07-17 | |||
| INTC | 99% | 96% | 91% | 725,494 | 454,121 | 271,373 | 4,355,574 | 6 | 2026-07-23 | 2026-09-18 | 2026-07-17 |
| INTU | 52% | 61% | 41% | 27,643 | 15,935 | 11,708 | 109,056 | 34 | 2026-08-20 | 2026-09-18 | 2026-07-17 |
| IONQ | 104% | 65% | 50% | 273,575 | 74,476 | 199,099 | 658,914 | 26 | 2026-08-12 | 2026-09-18 | 2026-07-17 |
| IONS | 5,169 | 2,891 | 2,278 | 41,852 | 12 | 2026-07-29 | 2026-09-18 | 2026-07-17 | |||
| IOT | 59% | 40% | 22% | 6,465 | 5,632 | 833 | 72,193 | 41 | 2026-08-27 | 2026-09-18 | 2026-07-17 |
| IREN | 129% | 82% | 54% | 383,141 | 160,075 | 223,066 | 2,511,195 | 61 | 2026-09-16 | 2026-09-18 | 2026-07-17 |
| ISRG | 60% | 96% | 69% | 26,910 | 16,265 | 10,645 | 73,867 | 95 | 2026-10-20 | 2026-09-18 | 2026-07-17 |
| IWM | 16% | 7% | 16% | 1,707,645 | 667,857 | 1,039,788 | 6,061,858 | 2026-09-18 | 2026-07-17 | ||
| IYR | 16% | 17% | 1% | 5,293 | 4,543 | 750 | 42,569 | 2026-09-18 | 2026-07-17 | ||
| JBS | 790 | 593 | 197 | 58,914 | 24 | 2026-08-10 | 2026-09-18 | 2026-07-17 | |||
| JD | 36% | 27% | 31% | 34,022 | 24,364 | 9,658 | 589,284 | 27 | 2026-08-13 | 2026-09-18 | 2026-07-17 |
| JNJ | 22% | 45% | 34% | 41,216 | 34,932 | 6,284 | 270,427 | 95 | 2026-10-20 | 2026-09-18 | 2026-07-17 |
| JPM | 23% | 29% | 27% | 47,377 | 26,577 | 20,800 | 511,561 | 88 | 2026-10-13 | 2026-09-18 | 2026-07-17 |
| KEY | 3,599 | 2,269 | 1,330 | 41,584 | 4 | 2026-07-21 | 2026-09-18 | 2026-07-17 | |||
| KGC | 61% | 76% | 48% | 7,434 | 3,691 | 3,743 | 95,480 | 12 | 2026-07-29 | 2026-09-18 | 2026-07-17 |
| KHC | 31% | 57% | 100% | 54,747 | 50,103 | 4,644 | 313,700 | 19 | 2026-08-05 | 2026-09-18 | 2026-07-17 |
| KKR | 48% | 54% | 48% | 6,300 | 2,372 | 3,928 | 65,091 | 13 | 2026-07-30 | 2026-09-18 | 2026-07-17 |
| KLAC | 20,845 | 4,873 | 15,972 | 143,349 | 11 | 2026-07-28 | 2026-09-18 | 2026-07-17 | |||
| KLAR | 69% | 9% | 10% | 6,681 | 3,894 | 2,787 | 80,464 | 32 | 2026-08-18 | 2026-09-18 | 2026-07-17 |
| KMB | 26% | 41% | 31% | 2,825 | 1,860 | 965 | 47,796 | 18 | 2026-08-04 | 2026-09-18 | 2026-07-17 |
| KMI | 30% | 80% | 89% | 8,735 | 4,675 | 4,060 | 152,832 | 5 | 2026-07-22 | 2026-09-18 | 2026-07-17 |
| KO | 19% | 49% | 0% | 54,244 | 35,823 | 18,421 | 505,650 | 11 | 2026-07-28 | 2026-09-18 | 2026-07-17 |
| KR | 31% | 60% | 3% | 16,153 | 4,410 | 11,743 | 83,567 | 49 | 2026-09-04 | 2026-09-18 | 2026-07-17 |
| KRE | 24% | 7% | 11% | 257,022 | 110,471 | 146,551 | 1,119,691 | 2026-09-18 | 2026-07-17 | ||
| KSA | 3 | 3 | 0 | 0 | 2026-09-18 | 2026-07-17 | |||||
| KSS | 61% | 9% | 7% | 4,873 | 4,022 | 851 | 51,069 | 27 | 2026-08-13 | 2026-09-18 | 2026-07-17 |
| KTOS | 72% | 35% | 31% | 8,031 | 5,645 | 2,386 | 77,809 | 13 | 2026-07-30 | 2026-09-18 | 2026-07-17 |
| KVUE | 42% | 68% | 100% | 1,253 | 820 | 433 | 68,836 | 26 | 2026-08-12 | 2026-09-18 | 2026-07-17 |
| KVYO | 1,821 | 1,494 | 327 | 31,508 | 19 | 2026-08-05 | 2026-09-18 | 2026-07-17 | |||
| KWEB | 27% | 10% | 1% | 96,472 | 79,688 | 16,784 | 2,129,539 | 2026-09-18 | 2026-07-17 | ||
| LEN | 46% | 55% | 45% | 2,287 | 804 | 1,483 | 36,427 | 62 | 2026-09-17 | 2026-09-18 | 2026-07-17 |
| LEVI | 2,760 | 2,036 | 724 | 30,673 | 82 | 2026-10-07 | 2026-09-18 | 2026-07-17 | |||
| LI | 53% | 44% | 52% | 5,857 | 3,013 | 2,844 | 106,680 | 47 | 2026-09-02 | 2026-09-18 | 2026-07-17 |
| LION | 8,877 | 8,816 | 61 | 32,709 | 20 | 2026-08-06 | 2026-09-18 | 2026-07-17 | |||
| LITE | 107% | 71% | 56% | 29,513 | 13,469 | 16,044 | 122,239 | 25 | 2026-08-11 | 2026-09-18 | 2026-07-17 |
| LLY | 40% | 70% | 38% | 59,781 | 30,767 | 29,014 | 187,132 | 19 | 2026-08-05 | 2026-09-18 | 2026-07-17 |
| LMND | 85% | 58% | 20% | 4,615 | 2,783 | 1,832 | 54,350 | 19 | 2026-08-05 | 2026-09-18 | 2026-07-17 |
| LNG | 55% | 97% | 99% | 1,516 | 979 | 537 | 36,545 | 20 | 2026-08-06 | 2026-09-18 | 2026-07-17 |
| LOW | 37% | 86% | 60% | 8,674 | 4,230 | 4,444 | 89,047 | 33 | 2026-08-19 | 2026-09-18 | 2026-07-17 |
| LPTH | 1,554 | 866 | 688 | 33,401 | 55 | 2026-09-10 | 2026-09-18 | 2026-07-17 | |||
| LQD | 5% | 12% | 87% | 214,518 | 22,685 | 191,833 | 330,709 | 2026-09-18 | 2026-07-17 | ||
| LQDA | 107% | 24% | 21% | 8,391 | 5,399 | 2,992 | 69,879 | 20 | 2026-08-06 | 2026-09-18 | 2026-07-17 |
| LRCX | 101% | 98% | 96% | 71,513 | 30,807 | 40,706 | 373,219 | 12 | 2026-07-29 | 2026-09-18 | 2026-07-17 |
| LULU | 41% | 25% | 13% | 25,359 | 12,388 | 12,971 | 178,239 | 41 | 2026-08-27 | 2026-09-18 | 2026-07-17 |
| LUNR | 104% | 18% | 45% | 37,690 | 14,630 | 23,060 | 222,948 | 32 | 2026-08-18 | 2026-09-18 | 2026-07-17 |
| LUV | 58% | 78% | 55% | 13,475 | 10,696 | 2,779 | 146,376 | 5 | 2026-07-22 | 2026-09-18 | 2026-07-17 |
| LVS | 49% | 86% | 8% | 3,748 | 1,885 | 1,863 | 49,890 | 5 | 2026-07-22 | 2026-09-18 | 2026-07-17 |
| LYB | 1,481 | 980 | 501 | 47,291 | 14 | 2026-07-31 | 2026-09-18 | 2026-07-17 | |||
| LYFT | 54% | 35% | 89% | 10,628 | 6,604 | 4,024 | 339,572 | 26 | 2026-08-12 | 2026-09-18 | 2026-07-17 |
| M | 54% | 55% | 9% | 6,598 | 4,435 | 2,163 | 51,799 | 39 | 2026-08-25 | 2026-09-18 | 2026-07-17 |
| MA | 34% | 96% | 79% | 8,601 | 4,476 | 4,125 | 73,162 | 13 | 2026-07-30 | 2026-09-18 | 2026-07-17 |
| MARA | 89% | 60% | 100% | 376,809 | 300,539 | 76,270 | 1,238,073 | 26 | 2026-08-12 | 2026-09-18 | 2026-07-17 |
| MAT | 12,374 | 4,444 | 7,930 | 42,217 | 18 | 2026-08-04 | 2026-09-18 | 2026-07-17 | |||
| MCD | 26% | 89% | 97% | 23,127 | 14,119 | 9,008 | 171,621 | 18 | 2026-08-04 | 2026-09-18 | 2026-07-17 |
| MCHP | 92% | 99% | 100% | 25,189 | 9,161 | 16,028 | 232,550 | 18 | 2026-08-04 | 2026-09-18 | 2026-07-17 |
| MDB | 73% | 69% | 37% | 7,232 | 3,762 | 3,470 | 61,054 | 41 | 2026-08-27 | 2026-09-18 | 2026-07-17 |
| MDLZ | 31% | 64% | 100% | 1,584 | 1,117 | 467 | 41,949 | 11 | 2026-07-28 | 2026-09-18 | 2026-07-17 |
| MDT | 24% | 52% | 100% | 15,910 | 12,436 | 3,474 | 161,307 | 39 | 2026-08-25 | 2026-09-18 | 2026-07-17 |
| MEOH | 101 | 100 | 1 | 40,946 | 19 | 2026-08-05 | 2026-09-18 | 2026-07-17 | |||
| MET | 4,536 | 3,914 | 622 | 28,560 | 19 | 2026-08-05 | 2026-09-18 | 2026-07-17 | |||
| META | 49% | 92% | 61% | 442,239 | 304,446 | 137,793 | 2,466,882 | 12 | 2026-07-29 | 2026-09-18 | 2026-07-17 |
| METC | 23,070 | 22,169 | 901 | 66,719 | 25 | 2026-08-11 | 2026-09-18 | 2026-07-17 | |||
| MGNI | 406 | 251 | 155 | 33,073 | 19 | 2026-08-05 | 2026-09-18 | 2026-07-17 | |||
| MIR | 302 | 293 | 9 | 53,169 | 11 | 2026-07-28 | 2026-09-18 | 2026-07-17 | |||
| MITK | 698 | 683 | 15 | 31,648 | 6 | 2026-07-23 | 2026-09-18 | 2026-07-17 | |||
| MKC | 2,045 | 1,171 | 874 | 39,893 | 81 | 2026-10-06 | 2026-09-18 | 2026-07-17 | |||
| MMM | 39% | 85% | 57% | 9,538 | 7,837 | 1,701 | 73,735 | 4 | 2026-07-21 | 2026-09-18 | 2026-07-17 |
| MO | 35% | 98% | 87% | 15,634 | 10,032 | 5,602 | 202,865 | 13 | 2026-07-30 | 2026-09-18 | 2026-07-17 |
| MOS | 57% | 73% | 33% | 6,190 | 4,191 | 1,999 | 197,135 | 18 | 2026-08-04 | 2026-09-18 | 2026-07-17 |
| MP | 69% | 18% | 20% | 30,612 | 15,162 | 15,450 | 307,937 | 13 | 2026-07-30 | 2026-09-18 | 2026-07-17 |
| MPLX | 1,791 | 918 | 873 | 39,772 | 18 | 2026-08-04 | 2026-09-18 | 2026-07-17 | |||
| MRK | 32% | 68% | 43% | 29,687 | 21,203 | 8,484 | 279,650 | 18 | 2026-08-04 | 2026-09-18 | 2026-07-17 |
| MRNA | 106% | 100% | 100% | 80,137 | 69,147 | 10,990 | 429,696 | 14 | 2026-07-31 | 2026-09-18 | 2026-07-17 |
| MRVL | 95% | 84% | 56% | 306,053 | 199,472 | 106,581 | 1,329,529 | 34 | 2026-08-20 | 2026-09-18 | 2026-07-17 |
| MS | 34% | 65% | 100% | 23,989 | 12,274 | 11,715 | 210,812 | 89 | 2026-10-14 | 2026-09-18 | 2026-07-17 |
| MSFT | 44% | 96% | 63% | 827,462 | 632,309 | 195,153 | 3,934,489 | 12 | 2026-07-29 | 2026-09-18 | 2026-07-17 |
| MSTR | 89% | 90% | 46% | 266,996 | 143,415 | 123,581 | 1,797,151 | 13 | 2026-07-30 | 2026-09-18 | 2026-07-17 |
| MTCH | 3,000 | 2,018 | 982 | 29,219 | 18 | 2026-08-04 | 2026-09-18 | 2026-07-17 | |||
| MXL | 7,293 | 4,669 | 2,624 | 57,790 | 6 | 2026-07-23 | 2026-09-18 | 2026-07-17 | |||
| NBIS | 152% | 100% | 100% | 325,497 | 119,143 | 206,354 | 1,218,839 | 12 | 2026-07-29 | 2026-09-18 | 2026-07-17 |
| NCLH | 63% | 71% | 99% | 7,948 | 3,581 | 4,367 | 227,454 | 13 | 2026-07-30 | 2026-09-18 | 2026-07-17 |
| NEE | 31% | 80% | 0% | 9,879 | 6,428 | 3,451 | 217,534 | 7 | 2026-07-24 | 2026-09-18 | 2026-07-17 |
| NEM | 55% | 73% | 4% | 14,258 | 8,424 | 5,834 | 269,794 | 6 | 2026-07-23 | 2026-09-18 | 2026-07-17 |
| NET | 68% | 65% | 32% | 12,298 | 4,745 | 7,553 | 127,866 | 20 | 2026-08-06 | 2026-09-18 | 2026-07-17 |
| NFLX | 67% | 98% | 81% | 887,773 | 586,690 | 301,083 | 4,208,964 | 95 | 2026-10-20 | 2026-09-18 | 2026-07-17 |
| NKE | 36% | 49% | 19% | 101,328 | 62,084 | 39,244 | 1,298,714 | 69 | 2026-09-24 | 2026-09-18 | 2026-07-17 |
| NLY | 82% | 98% | 64% | 6,504 | 3,030 | 3,474 | 80,996 | 4 | 2026-07-21 | 2026-09-18 | 2026-07-17 |
| NN | 114% | 42% | 39% | 24,837 | 21,660 | 3,177 | 154,211 | 26 | 2026-08-12 | 2026-09-18 | 2026-07-17 |
| NNE | 104% | 55% | 10% | 8,053 | 2,737 | 5,316 | 63,810 | 27 | 2026-08-13 | 2026-09-18 | 2026-07-17 |
| NOK | 82% | 63% | 58% | 389,209 | 248,883 | 140,326 | 3,569,444 | 6 | 2026-07-23 | 2026-09-18 | 2026-07-17 |
| NOW | 92% | 99% | 80% | 199,428 | 120,531 | 78,897 | 1,155,198 | 5 | 2026-07-22 | 2026-09-18 | 2026-07-17 |
| NRG | 54% | 54% | 8% | 1,543 | 1,188 | 355 | 45,369 | 18 | 2026-08-04 | 2026-09-18 | 2026-07-17 |
| NTLA | 10,377 | 4,349 | 6,028 | 48,432 | 13 | 2026-07-30 | 2026-09-18 | 2026-07-17 | |||
| NTSK | 1,540 | 1,260 | 280 | 41,087 | 75 | 2026-09-30 | 2026-09-18 | 2026-07-17 | |||
| NU | 40% | 36% | 0% | 38,250 | 23,494 | 14,756 | 1,294,593 | 32 | 2026-08-18 | 2026-09-18 | 2026-07-17 |
| NUGT | 79% | 21% | 1% | 1,850 | 1,217 | 633 | 6,862 | 2026-09-18 | 2026-07-17 | ||
| NVDA | 37% | 34% | 0% | 2,529,472 | 1,704,536 | 824,936 | 11,807,017 | 40 | 2026-08-26 | 2026-09-18 | 2026-07-17 |
| NVO | 42% | 36% | 23% | 72,862 | 48,820 | 24,042 | 1,162,065 | 19 | 2026-08-05 | 2026-09-18 | 2026-07-17 |
| NVTS | 122% | 34% | 40% | 46,107 | 20,292 | 25,815 | 424,079 | 10 | 2026-07-27 | 2026-09-18 | 2026-07-17 |
| o | 9,902 | 9,039 | 863 | 97,311 | 19 | 2026-08-05 | 2026-09-18 | 2026-07-17 | |||
| OIH | 710 | 348 | 362 | 4,607 | 2026-09-18 | 2026-07-17 | |||||
| OKE | 3,162 | 2,272 | 890 | 74,576 | 17 | 2026-08-03 | 2026-09-18 | 2026-07-17 | |||
| OKLO | 91% | 20% | 22% | 119,904 | 34,701 | 85,203 | 519,615 | 32 | 2026-08-18 | 2026-09-18 | 2026-07-17 |
| OKTA | 67% | 78% | 4% | 4,805 | 2,400 | 2,405 | 58,219 | 47 | 2026-09-02 | 2026-09-18 | 2026-07-17 |
| ON | 98% | 98% | 84% | 26,315 | 8,779 | 17,536 | 186,215 | 17 | 2026-08-03 | 2026-09-18 | 2026-07-17 |
| ONON | 55% | 68% | 100% | 4,961 | 3,901 | 1,060 | 124,226 | 32 | 2026-08-18 | 2026-09-18 | 2026-07-17 |
| ORCL | 60% | 65% | 32% | 568,209 | 281,974 | 286,235 | 2,523,629 | 59 | 2026-09-14 | 2026-09-18 | 2026-07-17 |
| OSCR | 83% | 60% | 2% | 13,476 | 10,170 | 3,306 | 346,093 | 20 | 2026-08-06 | 2026-09-18 | 2026-07-17 |
| OSS | 1,046 | 799 | 247 | 33,707 | 20 | 2026-08-06 | 2026-09-18 | 2026-07-17 | |||
| OUST | 179% | 99% | 83% | 10,084 | 5,386 | 4,698 | 83,639 | 20 | 2026-08-06 | 2026-09-18 | 2026-07-17 |
| OXY | 35% | 48% | 35% | 27,479 | 22,392 | 5,087 | 440,751 | 19 | 2026-08-05 | 2026-09-18 | 2026-07-17 |
| P | 3,394 | 2,583 | 811 | 58,361 | 47 | 2026-09-02 | 2026-09-18 | 2026-07-17 | |||
| PAA | 45% | 83% | 36% | 5,998 | 5,925 | 73 | 104,135 | 21 | 2026-08-07 | 2026-09-18 | 2026-07-17 |
| PAAS | 54% | 35% | 32% | 5,432 | 3,474 | 1,958 | 166,237 | 26 | 2026-08-12 | 2026-09-18 | 2026-07-17 |
| PAGP | 849 | 584 | 265 | 35,525 | 21 | 2026-08-07 | 2026-09-18 | 2026-07-17 | |||
| PANW | 58% | 84% | 4% | 31,245 | 13,877 | 17,368 | 243,492 | 38 | 2026-08-24 | 2026-09-18 | 2026-07-17 |
| PATH | 80% | 71% | 4% | 28,799 | 22,526 | 6,273 | 592,112 | 53 | 2026-09-08 | 2026-09-18 | 2026-07-17 |
| PBR | 31% | 14% | 35% | 14,230 | 9,165 | 5,065 | 822,817 | 20 | 2026-08-06 | 2026-09-18 | 2026-07-17 |
| PCG | 46% | 73% | 45% | 5,217 | 3,092 | 2,125 | 1,055,803 | 6 | 2026-07-23 | 2026-09-18 | 2026-07-17 |
| PDD | 36% | 42% | 24% | 26,457 | 9,539 | 16,918 | 565,283 | 45 | 2026-08-31 | 2026-09-18 | 2026-07-17 |
| PENG | 7,650 | 5,044 | 2,606 | 65,407 | 88 | 2026-10-13 | 2026-09-18 | 2026-07-17 | |||
| PEP | 24% | 51% | 0% | 34,547 | 13,539 | 21,008 | 269,681 | 88 | 2026-10-13 | 2026-09-18 | 2026-07-17 |
| PFE | 31% | 81% | 0% | 130,119 | 101,169 | 28,950 | 2,086,471 | 18 | 2026-08-04 | 2026-09-18 | 2026-07-17 |
| PG | 27% | 83% | 13% | 18,265 | 8,818 | 9,447 | 298,965 | 12 | 2026-07-29 | 2026-09-18 | 2026-07-17 |
| PGY | 5,124 | 968 | 4,156 | 68,110 | 13 | 2026-07-30 | 2026-09-18 | 2026-07-17 | |||
| PINS | 68% | 82% | 1% | 20,602 | 15,942 | 4,660 | 185,023 | 18 | 2026-08-04 | 2026-09-18 | 2026-07-17 |
| PL | 96% | 34% | 24% | 32,189 | 9,632 | 22,557 | 194,788 | 59 | 2026-09-14 | 2026-09-18 | 2026-07-17 |
| PLNT | 23,847 | 23,726 | 121 | 38,608 | 25 | 2026-08-11 | 2026-09-18 | 2026-07-17 | |||
| PLTR | 60% | 78% | 40% | 421,981 | 294,584 | 127,397 | 2,839,622 | 17 | 2026-08-03 | 2026-09-18 | 2026-07-17 |
| PM | 39% | 86% | 0% | 7,572 | 3,991 | 3,581 | 72,986 | 5 | 2026-07-22 | 2026-09-18 | 2026-07-17 |
| PRU | 2,863 | 1,695 | 1,168 | 29,664 | 18 | 2026-08-04 | 2026-09-18 | 2026-07-17 | |||
| PYPL | 43% | 67% | 40% | 211,186 | 132,538 | 78,648 | 1,716,552 | 11 | 2026-07-28 | 2026-09-18 | 2026-07-17 |
| PZZA | 6,595 | 5,500 | 1,095 | 37,998 | 20 | 2026-08-06 | 2026-09-18 | 2026-07-17 | |||
| Q | 2,544 | 1,907 | 637 | 38,604 | 18 | 2026-08-04 | 2026-09-18 | 2026-07-17 | |||
| QBTS | 87% | 11% | 99% | 43,680 | 25,980 | 17,700 | 437,913 | 20 | 2026-08-06 | 2026-09-18 | 2026-07-17 |
| QCOM | 75% | 86% | 100% | 86,062 | 44,478 | 41,584 | 759,497 | 12 | 2026-07-29 | 2026-09-18 | 2026-07-17 |
| QSR | 3,933 | 3,901 | 32 | 40,016 | 20 | 2026-08-06 | 2026-09-18 | 2026-07-17 | |||
| QURE | 8,056 | 6,501 | 1,555 | 90,522 | 18 | 2026-08-04 | 2026-09-18 | 2026-07-17 | |||
| QXO | 68% | 64% | 0% | 16,450 | 12,674 | 3,776 | 459,032 | 25 | 2026-08-11 | 2026-09-18 | 2026-07-17 |
| RBLX | 92% | 88% | 50% | 20,002 | 10,944 | 9,058 | 214,188 | 13 | 2026-07-30 | 2026-09-18 | 2026-07-17 |
| RBRK | 75% | 60% | 41% | 2,444 | 1,388 | 1,056 | 55,796 | 59 | 2026-09-14 | 2026-09-18 | 2026-07-17 |
| RCL | 54% | 66% | 43% | 4,327 | 1,436 | 2,891 | 35,206 | 11 | 2026-07-28 | 2026-09-18 | 2026-07-17 |
| RDDT | 99% | 90% | 57% | 34,723 | 20,856 | 13,867 | 249,211 | 13 | 2026-07-30 | 2026-09-18 | 2026-07-17 |
| RGTI | 96% | 36% | 27% | 82,402 | 39,436 | 42,966 | 580,331 | 20 | 2026-08-06 | 2026-09-18 | 2026-07-17 |
| RIO | 2,034 | 1,177 | 857 | 41,787 | 12 | 2026-07-29 | 2026-09-18 | 2026-07-17 | |||
| RIOT | 91% | 57% | 46% | 142,348 | 86,460 | 55,888 | 566,848 | 13 | 2026-07-30 | 2026-09-18 | 2026-07-17 |
| RIVN | 83% | 90% | 20% | 138,380 | 116,145 | 22,235 | 1,608,950 | 13 | 2026-07-30 | 2026-09-18 | 2026-07-17 |
| RKLB | 96% | 54% | 49% | 222,728 | 126,664 | 96,064 | 893,665 | 20 | 2026-08-06 | 2026-09-18 | 2026-07-17 |
| RKT | 59% | 23% | 29% | 107,440 | 93,027 | 14,413 | 530,904 | 13 | 2026-07-30 | 2026-09-18 | 2026-07-17 |
| RMBS | 2,986 | 530 | 2,456 | 28,500 | 10 | 2026-07-27 | 2026-09-18 | 2026-07-17 | |||
| ROKU | 24% | 4% | 6% | 3,555 | 3,246 | 309 | 35,872 | 13 | 2026-07-30 | 2026-09-18 | 2026-07-17 |
| RTX | 32% | 71% | 100% | 8,344 | 4,946 | 3,398 | 108,414 | 6 | 2026-07-23 | 2026-09-18 | 2026-07-17 |
| RUN | 96% | 65% | 50% | 58,307 | 53,863 | 4,444 | 323,932 | 19 | 2026-08-05 | 2026-09-18 | 2026-07-17 |
| RVMD | 3,062 | 2,614 | 448 | 40,798 | 26 | 2026-08-12 | 2026-09-18 | 2026-07-17 | |||
| S | 71% | 72% | 82% | 5,225 | 4,904 | 321 | 189,254 | 41 | 2026-08-27 | 2026-09-18 | 2026-07-17 |
| SA | 3,309 | 2,402 | 907 | 40,207 | 32 | 2026-08-18 | 2026-09-18 | 2026-07-17 | |||
| SAP | 64% | 93% | 95% | 6,407 | 2,327 | 4,080 | 39,050 | 6 | 2026-07-23 | 2026-09-18 | 2026-07-17 |
| SBUX | 39% | 80% | 38% | 25,102 | 10,325 | 14,777 | 270,468 | 12 | 2026-07-29 | 2026-09-18 | 2026-07-17 |
| SCHW | 32% | 73% | 100% | 16,079 | 8,783 | 7,296 | 281,137 | 4 | 2026-07-21 | 2026-09-18 | 2026-07-17 |
| SE | 60% | 64% | 41% | 10,739 | 8,078 | 2,661 | 80,284 | 32 | 2026-08-18 | 2026-09-18 | 2026-07-17 |
| SEDG | 114% | 67% | 45% | 4,615 | 1,367 | 3,248 | 72,901 | 18 | 2026-08-04 | 2026-09-18 | 2026-07-17 |
| SHEL | 21% | 20% | 0% | 45,053 | 44,193 | 860 | 101,847 | 13 | 2026-07-30 | 2026-09-18 | 2026-07-17 |
| SHLS | 1,549 | 1,405 | 144 | 67,809 | 18 | 2026-08-04 | 2026-09-18 | 2026-07-17 | |||
| SHOP | 70% | 84% | 47% | 34,308 | 21,181 | 13,127 | 567,025 | 19 | 2026-08-05 | 2026-09-18 | 2026-07-17 |
| SIRI | 45% | 71% | 0% | 11,267 | 10,701 | 566 | 131,516 | 13 | 2026-07-30 | 2026-09-18 | 2026-07-17 |
| SKHY | 130% | 0% | 0% | 258,358 | 131,074 | 127,284 | 256,446 | 5 | 2026-07-22 | 2026-09-18 | 2026-07-17 |
| SKM | 2,492 | 1,486 | 1,006 | 96,609 | 25 | 2026-08-11 | 2026-09-18 | 2026-07-17 | |||
| SLB | 44% | 82% | 43% | 24,722 | 19,488 | 5,234 | 336,179 | 7 | 2026-07-24 | 2026-09-18 | 2026-07-17 |
| SLS | 207% | 33% | 20% | 46,564 | 27,028 | 19,536 | 718,363 | 20 | 2026-08-06 | 2026-09-18 | 2026-07-17 |
| SLV | 41% | 36% | 0% | 481,575 | 222,176 | 259,399 | 4,752,831 | 2026-09-18 | 2026-07-17 | ||
| SMCI | 94% | 86% | 54% | 306,573 | 201,878 | 104,695 | 1,757,889 | 25 | 2026-08-11 | 2026-09-18 | 2026-07-17 |
| SMMT | 129% | 84% | 45% | 11,768 | 10,757 | 1,011 | 45,446 | 26 | 2026-08-12 | 2026-09-18 | 2026-07-17 |
| SNOW | 64% | 67% | 33% | 21,532 | 11,011 | 10,521 | 267,022 | 40 | 2026-08-26 | 2026-09-18 | 2026-07-17 |
| SNY | 595 | 249 | 346 | 35,379 | 2026-09-18 | 2026-07-17 | |||||
| SO | 23% | 76% | 37% | 2,716 | 1,552 | 1,164 | 37,090 | 13 | 2026-07-30 | 2026-09-18 | 2026-07-17 |
| SOFI | 65% | 53% | 43% | 299,657 | 202,188 | 97,469 | 3,741,912 | 12 | 2026-07-29 | 2026-09-18 | 2026-07-17 |
| SOLS | 5,838 | 2,154 | 3,684 | 70,555 | 47 | 2026-09-02 | 2026-09-18 | 2026-07-17 | |||
| SONY | 47% | 82% | 4% | 5,753 | 5,260 | 493 | 123,092 | 20 | 2026-08-06 | 2026-09-18 | 2026-07-17 |
| SPCX | 83% | 67% | 13% | 733,764 | 433,131 | 300,633 | 2,453,695 | 20 | 2026-08-06 | 2026-09-18 | 2026-07-17 |
| SPOT | 56% | 82% | 47% | 8,088 | 4,301 | 3,787 | 45,586 | 18 | 2026-08-04 | 2026-09-18 | 2026-07-17 |
| SPXU | 51% | 63% | 100% | 1,371 | 1,259 | 112 | 7,168 | 2026-09-18 | 2026-07-17 | ||
| STM | 117% | 99% | 51% | 56,059 | 39,071 | 16,988 | 151,462 | 6 | 2026-07-23 | 2026-09-18 | 2026-07-17 |
| STRC | 4,688 | 2,981 | 1,707 | 67,326 | 13 | 2026-07-30 | 2026-09-18 | 2026-07-17 | |||
| STX | 139% | 100% | 100% | 39,243 | 22,619 | 16,624 | 108,764 | 11 | 2026-07-28 | 2026-09-18 | 2026-07-17 |
| STZ | 31% | 20% | 19% | 4,892 | 1,408 | 3,484 | 51,083 | 76 | 2026-10-01 | 2026-09-18 | 2026-07-17 |
| SU | 33% | 49% | 83% | 2,098 | 1,895 | 203 | 50,311 | 25 | 2026-08-11 | 2026-09-18 | 2026-07-17 |
| SWK | 632 | 523 | 109 | 34,741 | 12 | 2026-07-29 | 2026-09-18 | 2026-07-17 | |||
| SWKS | 3,108 | 760 | 2,348 | 79,439 | 11 | 2026-07-28 | 2026-09-18 | 2026-07-17 | |||
| T | 36% | 89% | 93% | 107,016 | 68,773 | 38,243 | 882,161 | 5 | 2026-07-22 | 2026-09-18 | 2026-07-17 |
| TBIL | 0 | 0 | 0 | 0 | 2026-09-18 | 2026-07-17 | |||||
| TBT | 2,591 | 2,377 | 214 | 7,116 | 2026-09-18 | 2026-07-17 | |||||
| TCOM | 2,884 | 1,311 | 1,573 | 58,741 | 62 | 2026-09-17 | 2026-09-18 | 2026-07-17 | |||
| TEAM | 87% | 77% | 50% | 5,229 | 3,175 | 2,054 | 50,346 | 20 | 2026-08-06 | 2026-09-18 | 2026-07-17 |
| TECH | 7,581 | 7,566 | 15 | 29,509 | 25 | 2026-08-11 | 2026-09-18 | 2026-07-17 | |||
| TEM | 86% | 76% | 89% | 26,016 | 19,854 | 6,162 | 294,350 | 13 | 2026-07-30 | 2026-09-18 | 2026-07-17 |
| TER | 124% | 99% | 5% | 7,411 | 4,398 | 3,013 | 31,073 | 11 | 2026-07-28 | 2026-09-18 | 2026-07-17 |
| TEVA | 54% | 80% | 7% | 3,240 | 777 | 2,463 | 103,532 | 12 | 2026-07-29 | 2026-09-18 | 2026-07-17 |
| TFC | 7,450 | 5,134 | 2,316 | 77,604 | -1 | 2026-07-16 | 2026-09-18 | 2026-07-17 | |||
| TGT | 34% | 38% | 14% | 23,177 | 15,560 | 7,617 | 263,565 | 33 | 2026-08-19 | 2026-09-18 | 2026-07-17 |
| THD | 233 | 2 | 231 | 0 | 2026-09-18 | 2026-07-17 | |||||
| TJX | 26% | 65% | 35% | 6,887 | 4,454 | 2,433 | 63,966 | 33 | 2026-08-19 | 2026-09-18 | 2026-07-17 |
| TLN | 73% | 75% | 44% | 5,616 | 4,195 | 1,421 | 30,499 | 19 | 2026-08-05 | 2026-09-18 | 2026-07-17 |
| TLT | 9% | 17% | 100% | 579,624 | 376,240 | 203,384 | 7,017,104 | 2026-09-18 | 2026-07-17 | ||
| TMDX | 1,475 | 885 | 590 | 35,179 | 13 | 2026-07-30 | 2026-09-18 | 2026-07-17 | |||
| TMUS | 79% | 100% | 100% | 4,461 | 2,044 | 2,417 | 102,344 | 6 | 2026-07-23 | 2026-09-18 | 2026-07-17 |
| TOST | 52% | 43% | 28% | 5,742 | 3,421 | 2,321 | 170,842 | 25 | 2026-08-11 | 2026-09-18 | 2026-07-17 |
| TRIP | 64% | 43% | 100% | 5,561 | 4,918 | 643 | 110,052 | 13 | 2026-07-30 | 2026-09-18 | 2026-07-17 |
| TSCO | 73% | 99% | 11% | 7,327 | 5,537 | 1,790 | 99,418 | 6 | 2026-07-23 | 2026-09-18 | 2026-07-17 |
| TSEM | 126% | 96% | 86% | 4,955 | 2,116 | 2,839 | 30,168 | 18 | 2026-08-04 | 2026-09-18 | 2026-07-17 |
| TSLA | 54% | 86% | 45% | 1,929,639 | 1,074,599 | 855,040 | 4,267,608 | 5 | 2026-07-22 | 2026-09-18 | 2026-07-17 |
| TSM | 50% | 83% | 100% | 401,580 | 221,832 | 179,748 | 1,836,888 | 90 | 2026-10-15 | 2026-09-18 | 2026-07-17 |
| TTD | 78% | 76% | 96% | 28,161 | 18,558 | 9,603 | 513,602 | 20 | 2026-08-06 | 2026-09-18 | 2026-07-17 |
| TTWO | 45% | 67% | 37% | 7,892 | 4,054 | 3,838 | 175,520 | 21 | 2026-08-07 | 2026-09-18 | 2026-07-17 |
| TXN | 79% | 99% | 0% | 16,420 | 10,626 | 5,794 | 131,035 | 5 | 2026-07-22 | 2026-09-18 | 2026-07-17 |
| U | 82% | 66% | 28% | 17,615 | 6,346 | 11,269 | 235,570 | 19 | 2026-08-05 | 2026-09-18 | 2026-07-17 |
| UAL | 49% | 35% | 29% | 40,730 | 23,039 | 17,691 | 183,313 | 95 | 2026-10-20 | 2026-09-18 | 2026-07-17 |
| UBER | 48% | 88% | 59% | 94,078 | 62,792 | 31,286 | 854,989 | 19 | 2026-08-05 | 2026-09-18 | 2026-07-17 |
| UBS | 4,099 | 1,878 | 2,221 | 29,563 | 12 | 2026-07-29 | 2026-09-18 | 2026-07-17 | |||
| UL | 25% | 39% | 0% | 1,912 | 810 | 1,102 | 30,722 | 11 | 2026-07-28 | 2026-09-18 | 2026-07-17 |
| UMAC | 133% | 62% | 16% | 7,507 | 3,001 | 4,506 | 71,145 | 27 | 2026-08-13 | 2026-09-18 | 2026-07-17 |
| UMC | 101,727 | 97,414 | 4,313 | 131,133 | 12 | 2026-07-29 | 2026-09-18 | 2026-07-17 | |||
| UNG | 32% | 2% | 33% | 41,415 | 33,627 | 7,788 | 253,727 | 2026-09-18 | 2026-07-17 | ||
| UNH | 30% | 23% | 2% | 196,071 | 120,527 | 75,544 | 824,311 | 84 | 2026-10-09 | 2026-09-18 | 2026-07-17 |
| UNL | 22 | 21 | 1 | 0 | 2026-09-18 | 2026-07-17 | |||||
| UNM | 390 | 316 | 74 | 38,359 | 11 | 2026-07-28 | 2026-09-18 | 2026-07-17 | |||
| UNP | 51% | 99% | 3% | 16,234 | 13,543 | 2,691 | 57,661 | 6 | 2026-07-23 | 2026-09-18 | 2026-07-17 |
| UPS | 40% | 89% | 45% | 23,958 | 18,757 | 5,201 | 297,120 | 11 | 2026-07-28 | 2026-09-18 | 2026-07-17 |
| UPST | 84% | 64% | 27% | 14,481 | 6,560 | 7,921 | 157,672 | 18 | 2026-08-04 | 2026-09-18 | 2026-07-17 |
| URA | 63% | 71% | 100% | 17,515 | 6,585 | 10,930 | 184,505 | 2026-09-18 | 2026-07-17 | ||
| USAR | 80% | 1% | 1% | 38,883 | 17,456 | 21,427 | 377,351 | 31 | 2026-08-17 | 2026-09-18 | 2026-07-17 |
| USB | 26% | 42% | 0% | 15,284 | 7,314 | 7,970 | 111,213 | 90 | 2026-10-15 | 2026-09-18 | 2026-07-17 |
| USO | 56% | 69% | 3% | 98,740 | 61,871 | 36,869 | 1,061,604 | 2026-09-18 | 2026-07-17 | ||
| UUP | 5,070 | 556 | 4,514 | 100,309 | 2026-09-18 | 2026-07-17 | |||||
| UUUU | 91% | 29% | 16% | 34,955 | 14,702 | 20,253 | 385,250 | 14 | 2026-07-31 | 2026-09-18 | 2026-07-17 |
| V | 30% | 91% | 82% | 33,824 | 19,739 | 14,085 | 295,792 | 11 | 2026-07-28 | 2026-09-18 | 2026-07-17 |
| VALE | 35% | 24% | 0% | 17,862 | 11,617 | 6,245 | 489,655 | 13 | 2026-07-30 | 2026-09-18 | 2026-07-17 |
| VELO | 1,646 | 1,019 | 627 | 32,694 | 26 | 2026-08-12 | 2026-09-18 | 2026-07-17 | |||
| VFC | 66% | 57% | 30% | 9,023 | 5,361 | 3,662 | 222,377 | 12 | 2026-07-29 | 2026-09-18 | 2026-07-17 |
| VG | 72% | 21% | 5% | 11,298 | 6,873 | 4,425 | 368,717 | 25 | 2026-08-11 | 2026-09-18 | 2026-07-17 |
| VIAV | 8,669 | 4,899 | 3,770 | 56,986 | 19 | 2026-08-05 | 2026-09-18 | 2026-07-17 | |||
| VICI | 3,640 | 2,593 | 1,047 | 49,430 | 12 | 2026-07-29 | 2026-09-18 | 2026-07-17 | |||
| VKTX | 89% | 62% | 26% | 9,462 | 7,098 | 2,364 | 127,433 | 12 | 2026-07-29 | 2026-09-18 | 2026-07-17 |
| VLO | 50% | 87% | 69% | 18,733 | 5,702 | 13,031 | 61,080 | 13 | 2026-07-30 | 2026-09-18 | 2026-07-17 |
| VNM | 20 | 20 | 0 | 0 | 2026-09-18 | 2026-07-17 | |||||
| VOD | 147% | 94% | 6% | 7,634 | 7,551 | 83 | 123,718 | 116 | 2026-11-10 | 2026-09-18 | 2026-07-17 |
| VOYG | 5,391 | 4,945 | 446 | 30,988 | 17 | 2026-08-03 | 2026-09-18 | 2026-07-17 | |||
| VRT | 79% | 87% | 65% | 35,453 | 9,287 | 26,166 | 274,898 | 12 | 2026-07-29 | 2026-09-18 | 2026-07-17 |
| VSAT | 3,410 | 2,797 | 613 | 67,652 | 26 | 2026-08-12 | 2026-09-18 | 2026-07-17 | |||
| VSH | 27,995 | 1,945 | 26,050 | 84,448 | 19 | 2026-08-05 | 2026-09-18 | 2026-07-17 | |||
| VST | 56% | 47% | 37% | 32,960 | 13,086 | 19,874 | 310,176 | 21 | 2026-08-07 | 2026-09-18 | 2026-07-17 |
| VTRS | 14,627 | 2,333 | 12,294 | 104,294 | 20 | 2026-08-06 | 2026-09-18 | 2026-07-17 | |||
| VZ | 31% | 88% | 99% | 64,328 | 44,160 | 20,168 | 1,054,585 | 7 | 2026-07-24 | 2026-09-18 | 2026-07-17 |
| W | 74% | 54% | 29% | 5,225 | 3,516 | 1,709 | 45,022 | 18 | 2026-08-04 | 2026-09-18 | 2026-07-17 |
| WBD | 45% | 71% | 42% | 98,644 | 33,653 | 64,991 | 1,845,555 | 13 | 2026-07-30 | 2026-09-18 | 2026-07-17 |
| WDAY | 75% | 87% | 59% | 4,655 | 2,760 | 1,895 | 71,075 | 34 | 2026-08-20 | 2026-09-18 | 2026-07-17 |
| WDC | 112% | 97% | 94% | 62,674 | 25,037 | 37,637 | 236,460 | 19 | 2026-08-05 | 2026-09-18 | 2026-07-17 |
| WFC | 29% | 53% | 39% | 56,588 | 31,247 | 25,341 | 670,017 | 88 | 2026-10-13 | 2026-09-18 | 2026-07-17 |
| WHR | 3,084 | 1,976 | 1,108 | 76,154 | 10 | 2026-07-27 | 2026-09-18 | 2026-07-17 | |||
| WMB | 27% | 30% | 99% | 3,709 | 2,937 | 772 | 227,779 | 17 | 2026-08-03 | 2026-09-18 | 2026-07-17 |
| WMT | 21% | 17% | 0% | 111,361 | 68,559 | 42,802 | 816,598 | 34 | 2026-08-20 | 2026-09-18 | 2026-07-17 |
| WOLF | 124% | 32% | 95% | 6,564 | 4,342 | 2,222 | 255,743 | 33 | 2026-08-19 | 2026-09-18 | 2026-07-17 |
| WPM | 48% | 41% | 24% | 4,316 | 1,878 | 2,438 | 45,162 | 20 | 2026-08-06 | 2026-09-18 | 2026-07-17 |
| WULF | 97% | 28% | 35% | 255,435 | 133,061 | 122,374 | 2,093,559 | 31 | 2026-08-17 | 2026-09-18 | 2026-07-17 |
| WYFI | 4,806 | 2,796 | 2,010 | 46,616 | 68 | 2026-09-23 | 2026-09-18 | 2026-07-17 | |||
| WYNN | 44% | 47% | 33% | 2,244 | 1,181 | 1,063 | 57,815 | 18 | 2026-08-04 | 2026-09-18 | 2026-07-17 |
| XBI | 34% | 73% | 47% | 78,295 | 36,062 | 42,233 | 314,092 | 2026-09-18 | 2026-07-17 | ||
| XE | 8,286 | 4,563 | 3,723 | 32,217 | 47 | 2026-09-02 | 2026-09-18 | 2026-07-17 | |||
| XHB | 36% | 50% | 95% | 20,319 | 11,941 | 8,378 | 91,252 | 2026-09-18 | 2026-07-17 | ||
| XLB | 19% | 27% | 0% | 204,042 | 1,241 | 202,801 | 87,819 | 2026-09-18 | 2026-07-17 | ||
| XLE | 27% | 67% | 8% | 121,767 | 64,028 | 57,739 | 2,638,505 | 2026-09-18 | 2026-07-17 | ||
| XLF | 15% | 23% | 25% | 116,707 | 68,850 | 47,857 | 3,343,340 | 2026-09-18 | 2026-07-17 | ||
| XLI | 22% | 66% | 32% | 109,261 | 7,271 | 101,990 | 126,954 | 2026-09-18 | 2026-07-17 | ||
| XLK | 37% | 90% | 67% | 30,091 | 13,383 | 16,708 | 269,293 | 2026-09-18 | 2026-07-17 | ||
| XLP | 16% | 62% | 31% | 28,598 | 9,685 | 18,913 | 269,427 | 2026-09-18 | 2026-07-17 | ||
| XLU | 14% | 8% | 20% | 13,181 | 6,315 | 6,866 | 424,340 | 2026-09-18 | 2026-07-17 | ||
| XLV | 14% | 13% | 30% | 27,148 | 14,801 | 12,347 | 287,901 | 2026-09-18 | 2026-07-17 | ||
| XLY | 21% | 22% | 45% | 114,389 | 2,185 | 112,204 | 146,004 | 2026-09-18 | 2026-07-17 | ||
| XME | 8,854 | 1,228 | 7,626 | 13,925 | 2026-09-18 | 2026-07-17 | |||||
| XOM | 27% | 45% | 0% | 103,450 | 74,465 | 28,985 | 679,107 | 14 | 2026-07-31 | 2026-09-18 | 2026-07-17 |
| XOP | 38% | 69% | 44% | 6,886 | 1,978 | 4,908 | 96,982 | 2026-09-18 | 2026-07-17 | ||
| XP | 62% | 53% | 13% | 588 | 372 | 216 | 46,183 | 32 | 2026-08-18 | 2026-09-18 | 2026-07-17 |
| XPER | 0 | 0 | 0 | 0 | 2026-09-18 | 2026-07-17 | |||||
| XPEV | 72% | 84% | 40% | 25,067 | 23,452 | 1,615 | 434,875 | 39 | 2026-08-25 | 2026-09-18 | 2026-07-17 |
| XRT | 22% | 2% | 99% | 9,166 | 1,063 | 8,103 | 44,332 | 2026-09-18 | 2026-07-17 | ||
| XYZ | 52% | 52% | 31% | 15,399 | 8,926 | 6,473 | 254,498 | 19 | 2026-08-05 | 2026-09-18 | 2026-07-17 |
| YPF | 3,897 | 3,061 | 836 | 57,257 | 21 | 2026-08-07 | 2026-09-18 | 2026-07-17 | |||
| Z | 2,448 | 575 | 1,873 | 31,152 | 19 | 2026-08-05 | 2026-09-18 | 2026-07-17 | |||
| ZETA | 86% | 78% | 47% | 27,616 | 21,015 | 6,601 | 277,720 | 19 | 2026-08-05 | 2026-09-18 | 2026-07-17 |
| ZIM | 51% | 28% | 32% | 3,228 | 1,577 | 1,651 | 69,839 | 33 | 2026-08-19 | 2026-09-18 | 2026-07-17 |
| ZM | 41% | 42% | 30% | 26,526 | 22,370 | 4,156 | 149,062 | 38 | 2026-08-24 | 2026-09-18 | 2026-07-17 |
| ZS | 64% | 60% | 100% | 14,218 | 8,011 | 6,207 | 124,161 | 53 | 2026-09-08 | 2026-09-18 | 2026-07-17 |
| ZTS | 4,393 | 2,780 | 1,613 | 72,355 | 20 | 2026-08-06 | 2026-09-18 | 2026-07-17 |
SlashTraders vs S&P 500: 450% Outperformance, Verified Trades and How to Copy Every Alert
Thanks for sharing the calculation of Option IV, it reminds me of my high school statistics course.
Just found out that Options Analyzer can really find a list of high IV stocks fast!
So I can find more Iron Condor trading opportunities.
Thank you, sir.
That's right.
You can trade LeSports and Woodhawks by understanding the relationship of volatility to option value.
Thanks for sharing the difference between IV and HV, it gives me more confidence in trading options!
HV and IV are both analyzing fluctuating data.
One is the standard deviation of the past.
One is the estimated future standard deviation