
To become a consistent and successful trader, it is important to build and follow strategies that have undergone thorough backtesting.
Today, we'll share a few practical backtesting methods from thinkorswim, so you can use historical prices to experiment the profitability of simple trading strategies.
What Is Backtesting?
Backtesting is a way to determine the effectiveness of a trading strategy using historical data. It can help you understand how a particular trade would play out in a given moment in the past.
The flash crash in 2020 is a great sample to test a portfolio’s hedging strategy to see how well it responds to sudden market crashes.
thinkorswim provides three important features that allow you to backtest and experiment with trading strategies using the historical price data:
- thinkBack
- thinkOnDemand
- Custom strategies
We will guide you through the functionality of each feature so you can create your own profitable trading strategies.
Use thinkBack to Turn Back Time and Replay Different Trades
You can find the thinkBack feature under the Analyze tab. The tool allows you to simulate the profit and loss of single or multiple trades entered at a certain point of time in the past using historical data.
You can choose the starting date of your backtesting using the calendar in the top right corner.
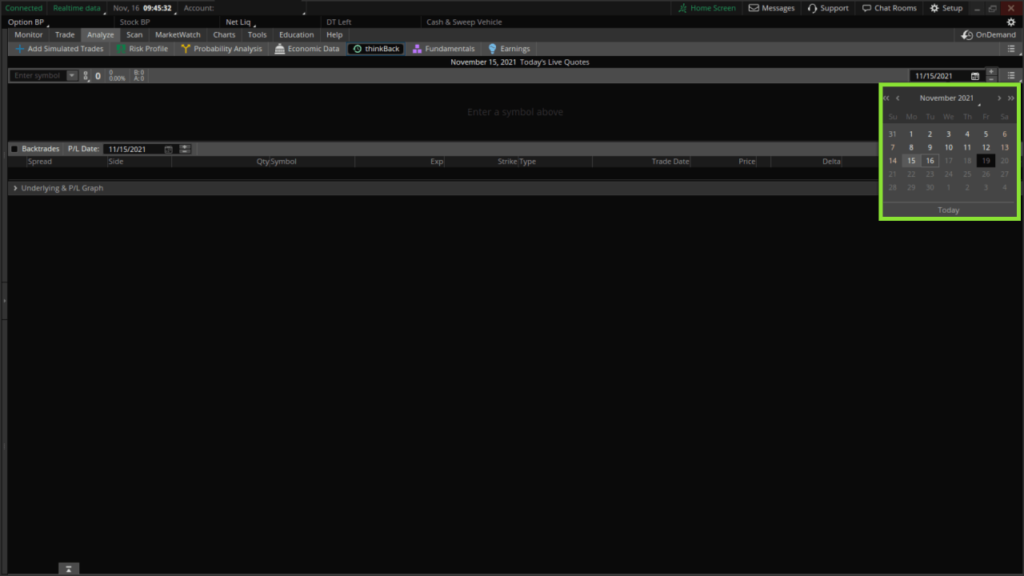
Let’s go back to the week immediately after the flash crash on March 27, 2020.
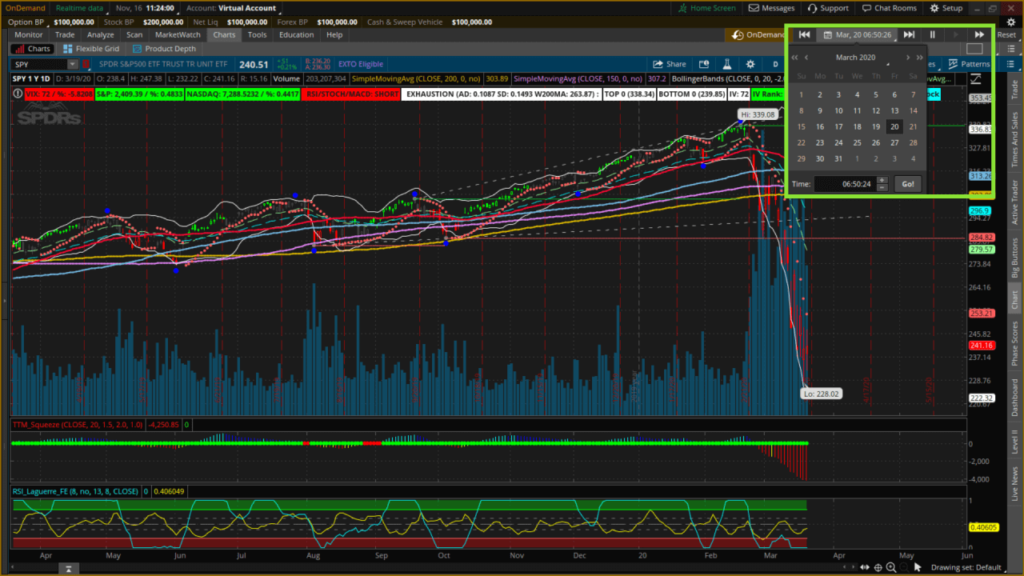
The SPY has dropped from the height of $339 to $218, then rebounded to $258. There are a lot of high-quality and extremely undervalued stocks available at that time.
We can simulate the profit and loss of different bullish strategies since the crash. Here is a list of strategies that we can test:
- Buy 100 shares of MSFT.
- Buy 10 shares of AMZN.
- Long 2 contracts of deep ITM FB Calls at $70 expiring on January 21, 2022.

After entering all trades, we can change the P/L Date for the Backtrades to see the impact of our trades. In this example, let’s move the P/L Date to November 15, 2021.
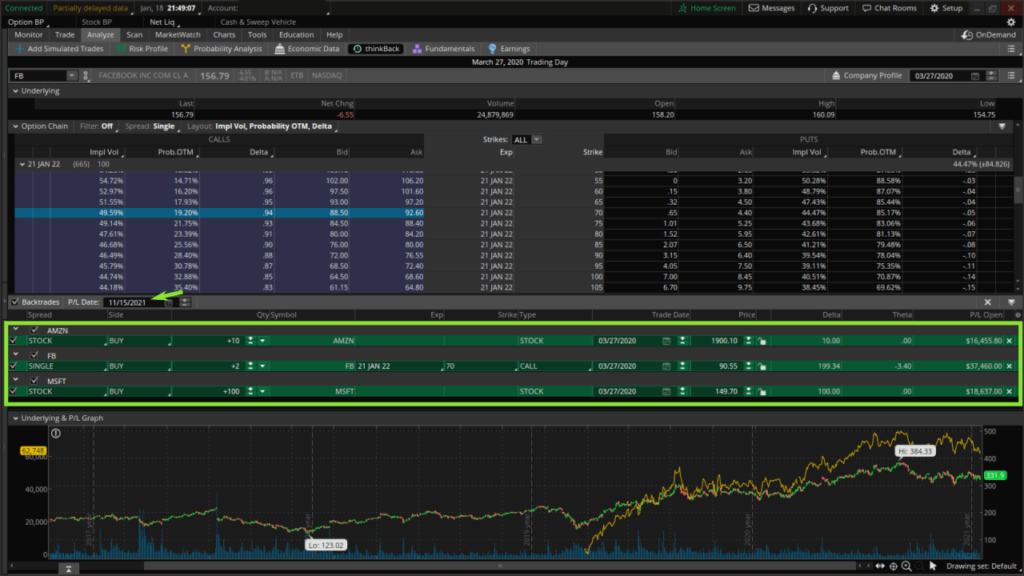
The thinkBack feature shows that our simulated trades on March 27, 2020, resulted in a profit of $72,552.80, with the long FB Call making the greatest gains.

thinkOnDemand actúa como una máquina del tiempo para una cuenta virtual
thinkOnDemand takes one step further than thinkBack by allowing you to perform paper trading on a virtual $100,000 account using historical data, with the following features:
- Go through past trading setups and strategies candle by candle.
- Simulate trades with virtual money and margin.
- Simulate portfolio performance over time.
- Fast forward or rewind to see the impact on existing positions.
- Study the risk profiles of past trade setups.
Clicking on the OnDemand button in the top right corner switches to a virtual account. Then you can use the controls to select a date in the past or fast forward and backwards in time.
There are some tips to get the most out of thinkOnDemand:
- Makes sure that the date and time that you select is within market hours, otherwise the price charts don’t do not update with the timer.
- When adjusting the time, it takes several seconds to update the price charts.
- Dynamic Watchlists and Scans do not function when using thinkOnDemand.
Use Custom Strategies to Simulate Trade Performance
While thinkBack and thinkOnDemand go back in time to test trades, we can use Strategies to simulate entry and exit points over time.
thinkorswim provides a comprehensive list of standard Studies and Strategies to choose from, we will show you how to build your own custom Studies to find a trading system.
Studies and Strategies are saved within thinkorswim in a Study Set. By understanding how Study Set works, you can customise Study Sets for trading forex, stocks, futures or options, each encompassing different indicators and chart settings.
Studies are great for chart analysis and technical indicators, while Strategies work best for backtesting.
Let’s start by creating a new Study Set called Backtesting_Strategies from Studies > Save Study Set.
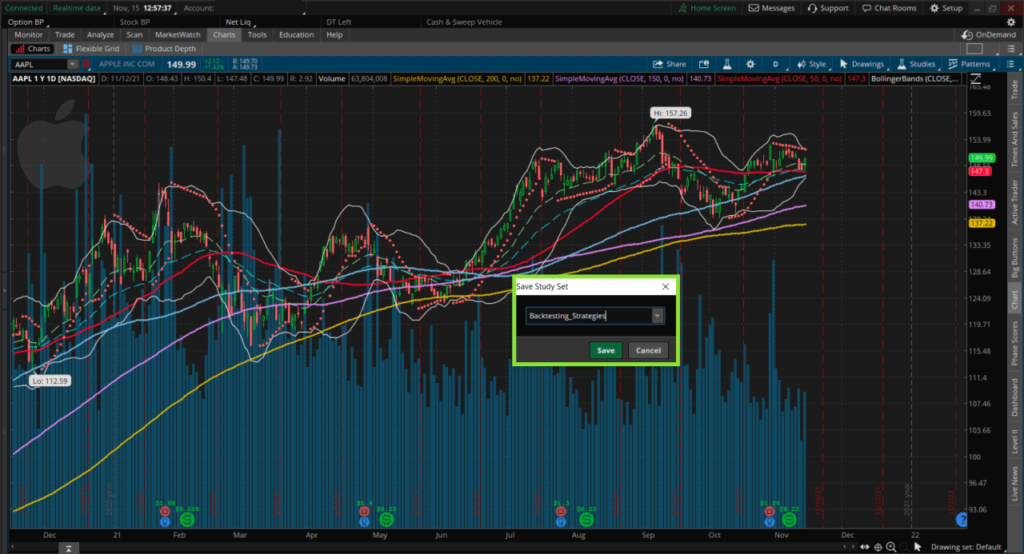
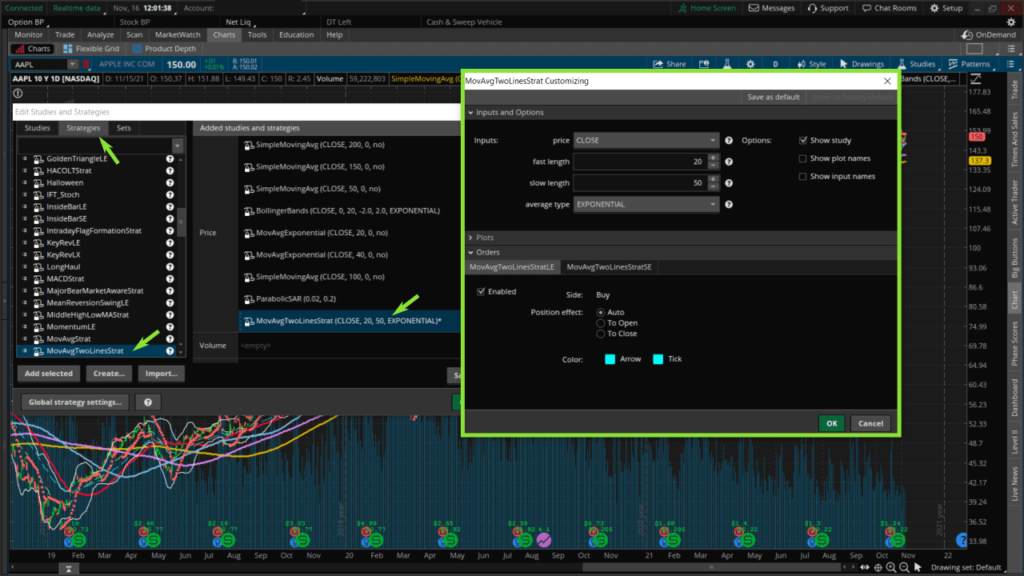
Let's try a simple trading system that has entry and exit points at crossovers of 20 and 50 Exponential Moving Averages (EMA), and test it over 10 years on AAPL’s daily chart.
We access the Studies and load the Study Set, Backtesting_Strategies, then Edit Studies.
We use the predefined moving average crossover strategy called MovAvgTwoLineStrat that we add to our Study Set.
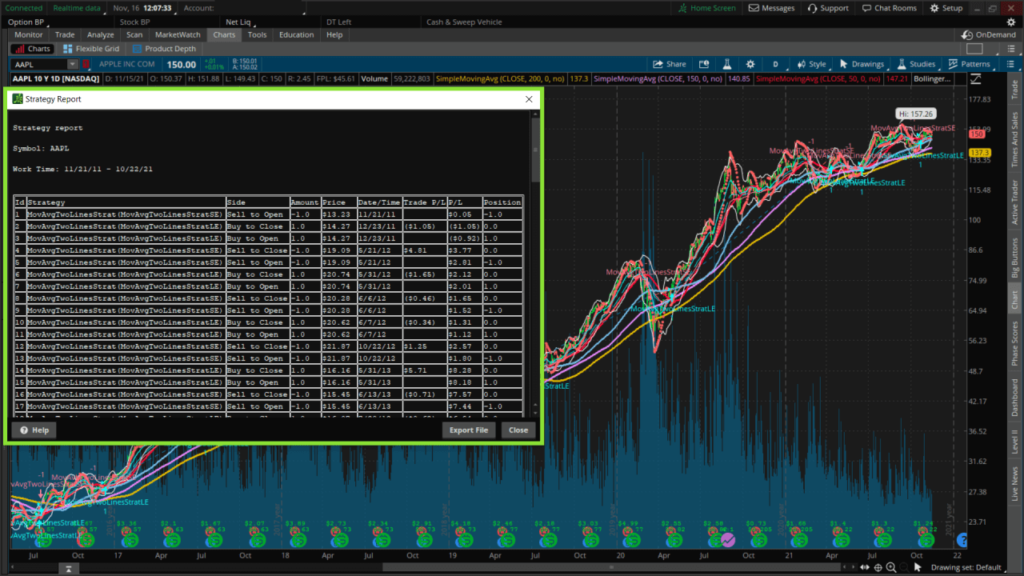
Once we see all the short and long entries on the chart, we can right mouse click on the MovAvgTwoLinesStrat and select Show report to see the trade log and performance of the system.
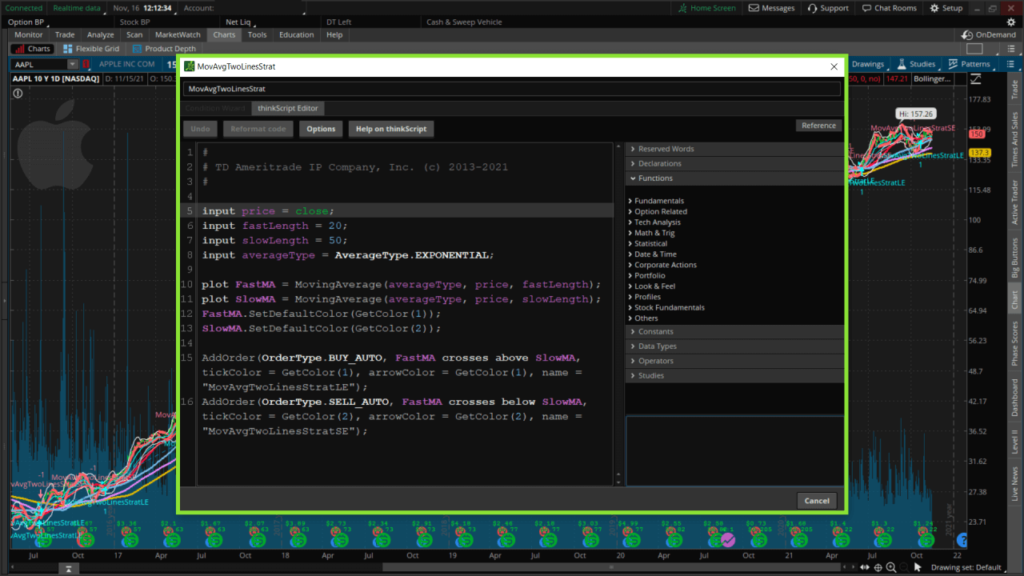
To customise the trading strategies further, you can use the programming language, thinkScript, to backtest any strategy you want.
Now you know the comprehensive set of backtesting tools available from thinkorswim you can use them to develop your own profitable trading systems. Alternatively, you can explore Infinox broker to get started with trading.
SlashTraders vs S&P 500: 450% Outperformance, Verified Trades and How to Copy Every Alert
Thanks for the info... but on backtesting the MovAvgTwoLinesStrat, the trade entries are plotted on the chart but the exits are not. After running the report and opening the code for this strategy in thinkscript, there is no apparent logic as to how/when trade exits are decided. running the report and opening the code for this strategy in thinkscript, there is no apparent logic as to how/when trade exits are decided. The only code shown is for trade entries ("MovAvgTwoLinesStrat"). shown is for trade entries ("LE" and "SE")... when I export the report to excel and run The only code shown is for trade entries ("LE" and "SE")... when I export the report to excel and run calculations to find any apparent relationships between the listed trade exits, there is no correlation between exit price, risk ratio, duration of When I export the report to excel and run calculations to find any apparent relationships between the listed trade exits, there is no correlation between exit price, risk ratio, duration of trades, or anything... it appears very random.
A simple strategy you can try is to exit when FastMA cross below the SlowMA, but you can code far more complex conditions for the exit of the trade.
https://slashtraders.com/wp-content/uploads/2023/07/exit-strategy.jpeg
Thank you for showing me how thinkback works on thinkorswim.
I'll certainly use thinkback to test out some trading strategies.
You're welcome.
Do try to use the backtest features to find profitable trading strategies.
So TDA has such a great backtesting function.
I'll try it some other time.
Yeah, it is.
When we want to try a new trading system, it's best to backtest it with different historical stock prices in order to be more confident that we can profit from the new trading strategy.
Brilliant article on backtesting!
I've been looking for a tutorial like this for ages.
Thanks.
You're welcome