
When you ask the most successful traders about the secrets to their success, one of the most important secrets would be their trading system. It is the magical formula that helps them generate consistent income from the market over and over again.
Today, we’ll share with you the secret sauce to the SlashTraders’ trading system, so you can copy our trades and find a trading system that can generate consistent profit for you.
Since 2022, SlashTraders has been running a math-based wheel and options income system on a fully transparent $2.5M live portfolio — every trade publicly logged, every loss clearly visible, and every return verified by API in real time. This guide will walk you through the complete method we use, including our stock screening tools and real-world examples.
Contents
What Is a Trading System?
A trading system is a set of defined and repeatable rules that help you find entry and exit points to trade the financial markets.
A successful trading system usually has the following components:
- A reliable win rate coupled with the right relative sizes of wins and losses make the expectancy of your trades a positive number, hence profitable.
- The expectancy of the trades should remain positive when you take into account the cost of commissions.
- The position size of each trade should be small enough that you don't suffer unrecoverable losses.
The Secrets to Our Trading System
The stock market is a pricing mechanism that tends to be 70-80% bullish but is in its nature purely random.
Our experience tells us, nobody, no system, no algorithm, no artificial intelligence, no analysts, no sentiments, and no ratings can be 100% accurate in predicting future price moves.
The ups and downs of the market prices can be likened to a pendulum:
The market is a pendulum that forever swings between unsustainable optimism (which makes stocks too expensive) and unjustified pessimism (which makes them too cheap). The Intelligent Investor is a realist who sells to optimists and buys from pessimists.
Benjamin Graham
Like many phenomena in and outside of economics, stock prices follow the movements of a pendulum, albeit with much more unpredictability, and the larger the timeframes you are looking at the more it is recognisable.
SlashTraders’ philosophy is no matter we are "trading options to generate consistent income" or "building our dividend portfolio that compounds growth", we want to use data to make high probability trades that have a positive expectancy.
In short, we combine the valuation of an underlying and look for discernable exhaustion of stock price movements over a long time.
So we combine fundamental analysis and technical analysis to look for converging trend signals to find entry points that generate the maximum possible positive expectancy in the stock market.
How Does Fundamental Analysis Work?
There are about 150,000 securities across 70+ exchanges listed across the global stock markets. At SlashTraders, we only consider about 0.5% of companies as investable out of these 150,000 globally stock-listed securities as good long-term investments.
Great companies are characterised by:
- Growing revenue
- Growing profit
- Low Debt to Equity Ratio
- Growing Free Cash Flow to reinvest
- Growing dividends
- Wide competitive moat
We compiled a database of about 1,000 growth and dividend stocks around the globe across all continents that we make available to our subscribers.
We constantly monitor these companies and perform valuations based on the Discounted Cash Flow (DCF) model calculating each underlying’s respective Fair Value. Then we can calculate the potential Upside of each stock based on the differences between Fair Value and current price.
Our investment is based on the philosophy of the greatest investor of all times, Warren Buffett. In other words, we only buy with our limited and hard-earned money great companies at or below Fair Value.
But, we can go one step further to combine Fundamental Analysis with Technical Analysis. Besides buying at discount to the current price, we only invest when the stock is also "technically undervalued".
How Does Technical Analysis Work?
In technical analysis, we look for discernable exhaustion of stock price movements over a long time.
For us, there are no bullish or bearish trends as such. An underlying is not bullish because its price is above 50 and 200 SMA (Simple Moving Average).
Bearish or bullish ratings mean nothing more than 50% of market participants hoping that it will go in the anticipated direction and the other half wondering why it should move in the anticipated direction.
From our point of view, an underlying is only bullish when the downtrend is exhausted while the stock is undervalued.
But in such instances, most analysts would rate the stock as bearish with low price targets and keep revising their ratings as they observe what just happened as contrary to their predictions.
At any given time, there are only very few stocks that meet both downtrend exhaustion while being heavily undervalued.

An Example of Downtrend Exhaustion and Heavily Undervalued
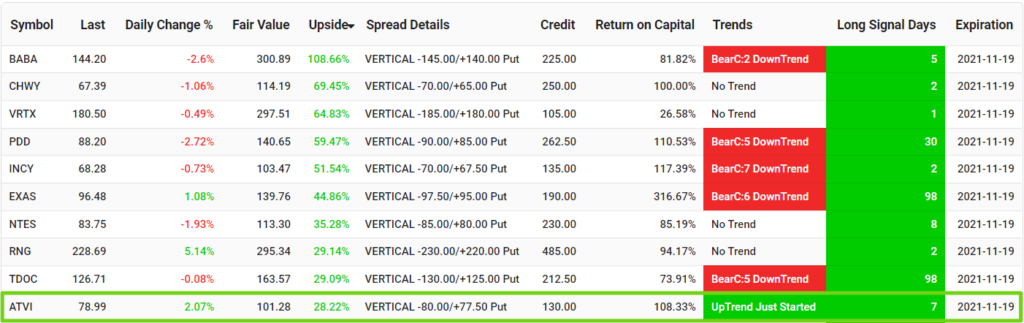
Our Bull Put Spread Screener uses historical chart analysis to find bottom out stocks that have a high probability of an upward correction that we can sell Bull Put Spreads to open.
There are three key metrics in the Bull Put Spread Screener that help us find heavily undervalued and bottomed out stocks:
- The options screener uses fundamental analysis to calculate a Fair Value of the underlying. Then compare that with the Last value to find the potential Upside of the stock. When the Upside is greater than 30%, we have high confidence in a bullish outlook.
- We also use chart analysis to see the short term movement of the stock, whether the underlying is in an uptrend or a downtrend, so we can time the market accordingly. When the Trends column turns green and shows BullC UpTrend with a number, we know the stock price has been bullish in consecutive days.
- Our screener's unique Long Signal Days uses chart analysis to find the long term trends of the underlying. When the Long Signal Days column turns green, and showing the number of days has passed since the last bottom out signal, we are confident the stock is ready to correct in a bullish direction.
When an undervalued stock has both Trends and Long Signal Days turn green, we can be confident of entering a bullish trade.
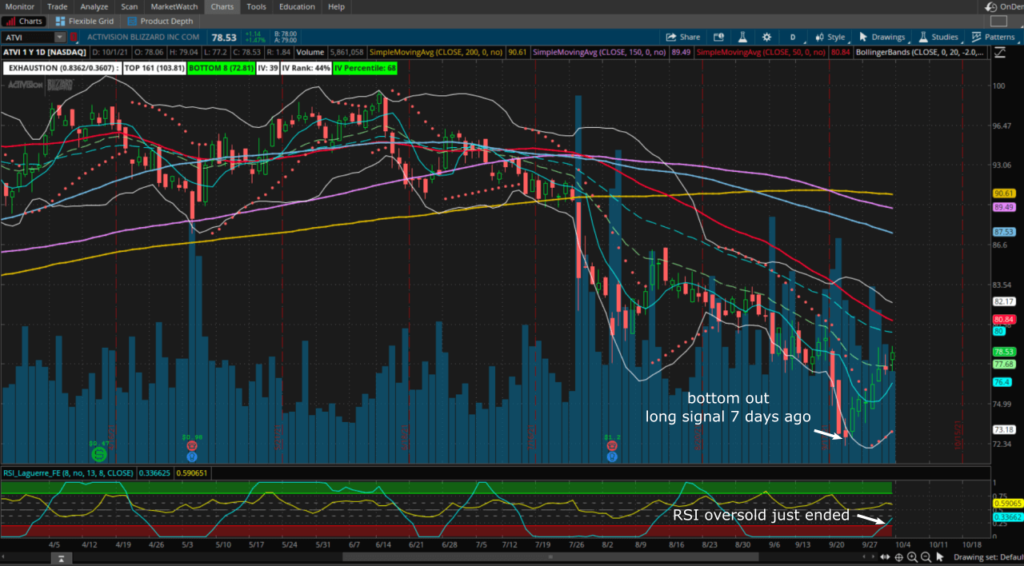
We can double-check the price charts to confirm the bottomed-outness of the trend.
Our Bullish Value Stocks section lists all the underlying in our database that is both fundamentally and technically undervalued right now. The additional Dividend Yield information allows us to find entry points for short, middle and long-term trades.
In other words, it is time to go long and be bullish despite analysts’ bearish outlook.
In the words of the legendary investor himself:
Be greedy when others are fearful.
Warren Buffet
So in SlashTraders’ trading strategy, we combine the valuation of an underlying and look for discernible exhaustion of stock price movements over a long time to find the best entry points.
When to Exit a Trade?
Our trading system is based on selling options that expire next month, so we can control the probability of success and Return on Capital, and profit from the gradual time value decay of options.
Any professional options seller will tell you not to keep the contracts open through to expiration, but exit early when the trade meets the following conditions:
- After a trade has reached at least half of the maximum profit, the marginal utility of the trade reduces. So we usually buy to close an options trade after about 60% profitability.
- We can also exit a profitable trade around 14 days from expiration, to prevent gamma risks.
- If a trade remains unprofitable around 14 days to expiration, but the stock remains both fundamentally and technically undervalued, we can roll the trade to next month.
- If the trade is unprofitable and no long undervalued, we will exit at a loss.
This way we can efficiently utilitise our capital in profitable trades, and cut our losses in losing trades. All for the sake of creating a profitable, positive expectancy trading system.
SlashTraders vs S&P 500: 450% Outperformance, Verified Trades and How to Copy Every Alert
I like your definition of high expectancy trading systems.
After all, a positive expectancy is what makes long term trading profitable.
It's so useful to have a trading system!
Yes, by creating a positive expectation trading style, you can use data to make decisions and reduce emotional trading errors
I analyzed all the stocks in the call list once and the bottoming algorithm was super accurate!
Thank you, you can refer to the list to trade high probability upside stocks.
Does a profitable trading system meaning generating an income over a long term?
Yes, a good trading system should have a positive expectancy to help you trade in a consistent way that generates long term income.
The higher the expectancy your trading system is will lead to the more profitable outcome for you.
There is no trading system that has a positive expectancy as such otherwise everyone in the market would trade it. Trading purely on chart analysis is like a 50/50 shot and taking in your emotions probably less than 50/50. 50/50 shot and taking in your emotions probably less than 50/50. Combining fundamental valuation + chart analysis is probably getting you to the closest possible level of positive expectancy. Combining fundamental valuation + chart analysis is probably getting you to the closest possible level of positive expectancy. Selling call spreads on fundamentally overvalued stocks having reached uptrend exhaustion on the chart and selling put spreads on fundamentally overvalued stocks has reached uptrend exhaustion. Selling put spreads on fundamentally undervalued stocks having reached downtrend exhaustion on the chart => positive expectancy.