
Do you want to know how professional investors pick stocks through analysis?
Today SlashTraders will show you what fundamental analysis and technical analysis are, and our shortcuts to picking bullish value stocks.
What Is Fundamental Analysis?
Fundamental analysis is a method that uses financial data and market forecasts to analyse a company's market capitalisation and its stock's Fair Value.
Value investors use financial reports such as Balance Sheets and Income Statements to understand a company's assets, debts and cash flow.
These data are useful in determining the company's operational capabilities, including Debt to Equity and EPS, then use P/E Ratio to find the stock's Fair Value.
Fundamental analysis through financial reports is especially useful for determining the value of a stable and profitable company like Microsoft. Trefis estimates the stock Fair Value through the investment and profitability of different Microsoft divisions:
- Intelligent Cloud contributes 37.4%.
- Productivity and Business Processes contribute 33.5%.
- More Personal Computing contributes 26.1%.
- Around $86 billion in cash contributes 3.1%.
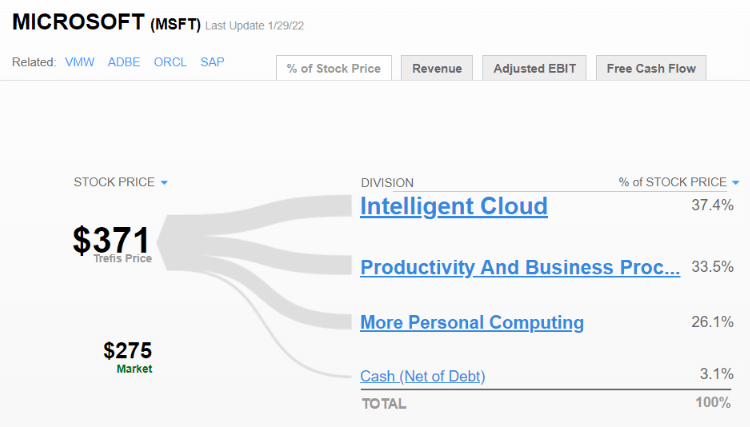
The estimate shows MSFT is worth around $371 in intrinsic value, meaning there is an Upside of 34.9% from the current $275 market price.
Future projection of a particular industry can help estimate a company's worth through future market growth and whether the company has leadership status. Tesla's leadership in high growth electric car and renewable energy markets contributes to its high market valuation.
But the downside of such speculative analysis means every financial analyst seems to have a different perspective on the market prospects, leading to the massive fluctuation in electric car company valuations, and unpredictable trends.
What Is Technical Analysis?
Technical analysis is a method that uses past stock price fluctuation patterns to deduce bullish and bearish signals to help us predict short and medium-term trends.
Common technical analysis indicators came to popularity through extensive backtesting to find consistent winning signals:
- Simple Moving Averages use 50-day, 100-day and 200-day stock price averages to minimise the impact of short term stock movement to find medium and long term price trends.
- Momentum indicators like RSI use price movements to find Oversold and Overbought conditions that predict bearish or bullish trends.
We can see clear bullish signals from recent META stock price charts:
- When the stock price stays below 50-day, 100-day and 200-day MA lines, with small signs of 50 MA curling up, there is a high probability that the stock price will revert to a bullish trend next.
- RSI shows the stock has recently transitioned from Oversold to Overbought.
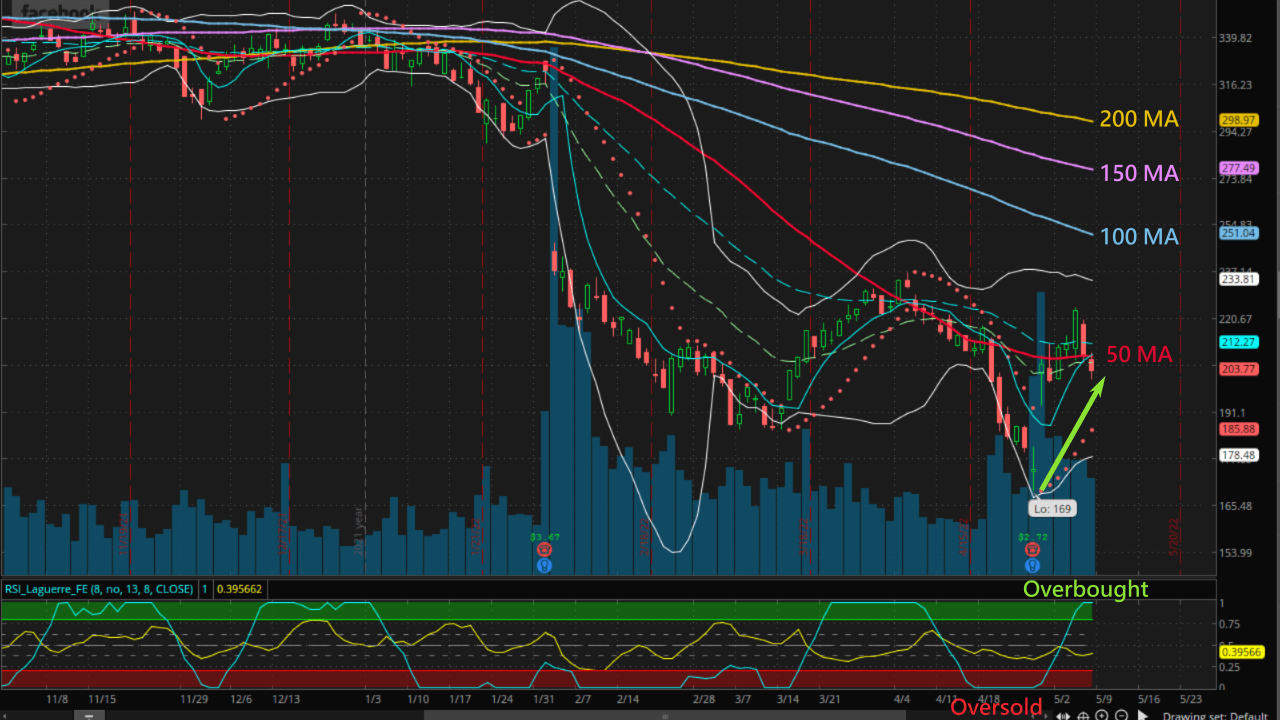
Both signals show a high probability of a bullish outlook for the Meta stock price.
What Is the Difference Between Fundamental and Technical Analysis?
Fundamental analysis and technical analysis provide guidelines to predict long term and short term directions of movement.
| Fundamental analysis | Technical analysis | |
|---|---|---|
| Method | Estimates intrinsic value through financial data and operational health | Uses historical data to find consistent trending signals |
| Strategies | Long term investment | Short to medium term trading |
| Cons | Unpredictable valuation based on market speculation | Future price trends may not follow past trends |

Our Shortcut to Picking Bullish Value Stocks
When we find a trading system that combines fundamental and technical analyses that provide consistent results, we can find undervalued, bullish value stocks in seconds.
The Bullish Value Stocks can help us find highly undervalued, blue-ship stocks that are great for investing long term.
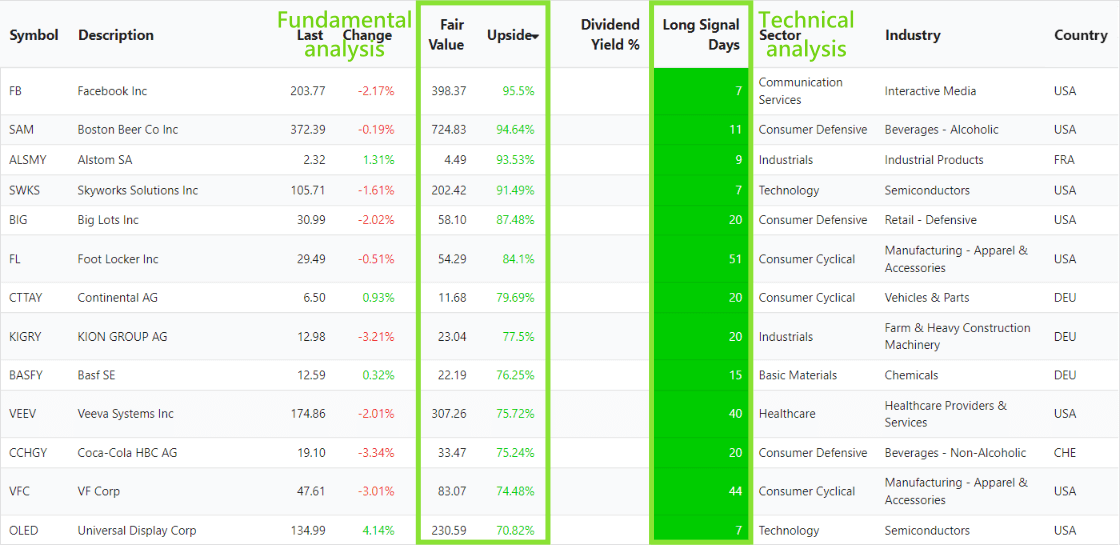
Fundamental analysis of FB stock shows the Fair Value as $398, with an Upside of 95.5%, meaning it is extremely undervalued. Technical analysis shows FB's Long Signal happened 7 trading days ago.
Therefore, both analyses are in agreement with a bullish outlook for FB, meaning right now is a great time to buy and hold the value stock.
SlashTraders vs S&P 500: 450% Outperformance, Verified Trades and How to Copy Every Alert
how do you assess fundamental fair price for a stock? thanks
We analyse the financial data and look at a company's assets, debts, cash flow...etc, and also look at the analysts' forecast of the same industry to find the Fair Value. We analyze the financial data and look at a company's assets, debts, cash flow...etc, and also look at the analysts' forecast of the same industry to find the Fair Value.