
Do you know how to look for long signals that indicate a stock has bottomed out?
Today SlashTraders will show you how to use our unique trading system and the Bull Put Spread Screener to find heavily undervalued stocks that you can buy the dip by trading high probability and high return bullish options.
Contents
What Is a Bull Put Vertical Spread?
A Bull Put Vertical Spread works by combining a short Put and a long Put at different strike prices that expire at the same time. The Put Vertical Spread is profitable if the underlying price goes up before the option expires.
Let's review the profit analyses of selling and buying Put options. We receive a premium when we short a Put option. If the underlying price goes up we make a profit.
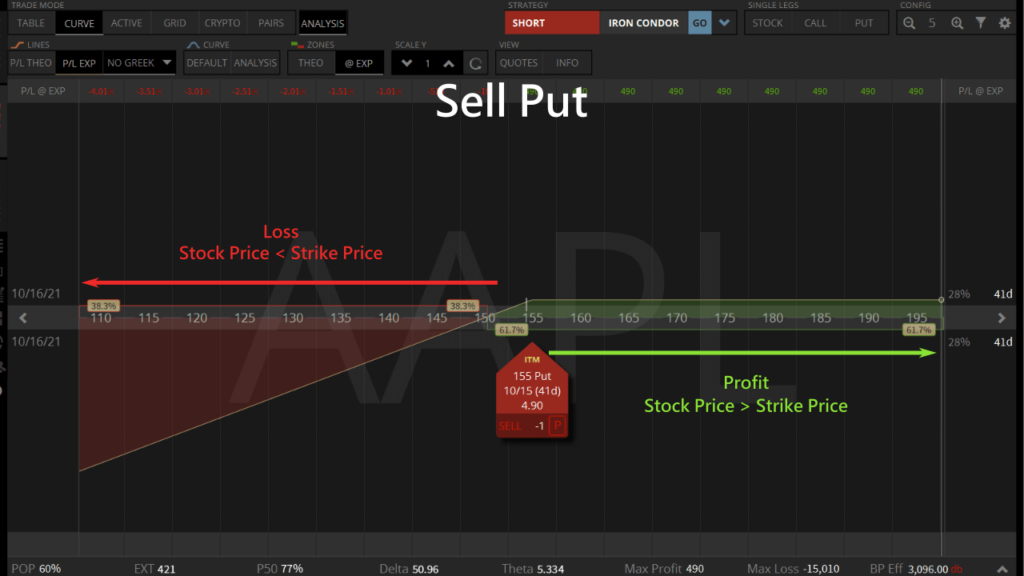
Although a Naked Put is easy to execute, if the underlying price goes down, the maximum loss is unlimited.
We pay a premium when we long a Put option. If the underlying price goes down we make $100 for every $1 drop.

But if the underlying price goes up instead, the value of the Put option expires worthless.
When we combine a short Put and a long Put at different strike prices we create a Put Vertical Spread. Since we want to trade bullish, the strike price of the short Put would be higher than the long Put.
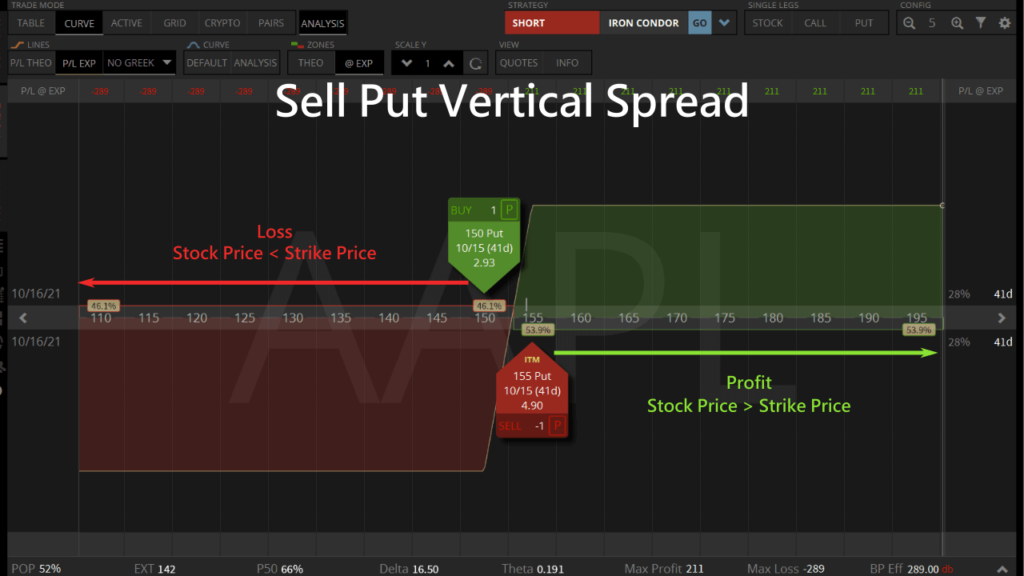
Compare this to a short naked Put, a Bull Put Vertical Spread can limit the maximum loss if we are wrong about the direction.
Why Bull Put Spread?
If we are confident about a bullish outlook, trading a short Bull Put Spread has higher leverage than buying stocks.
We can use AAPL to compare the differences between trading a Bull Put Vertical Spread that expires next month, and buying stocks. An ATM Bull Put Spread has a 54% chance of success, while buying stocks has a 50% success rate.
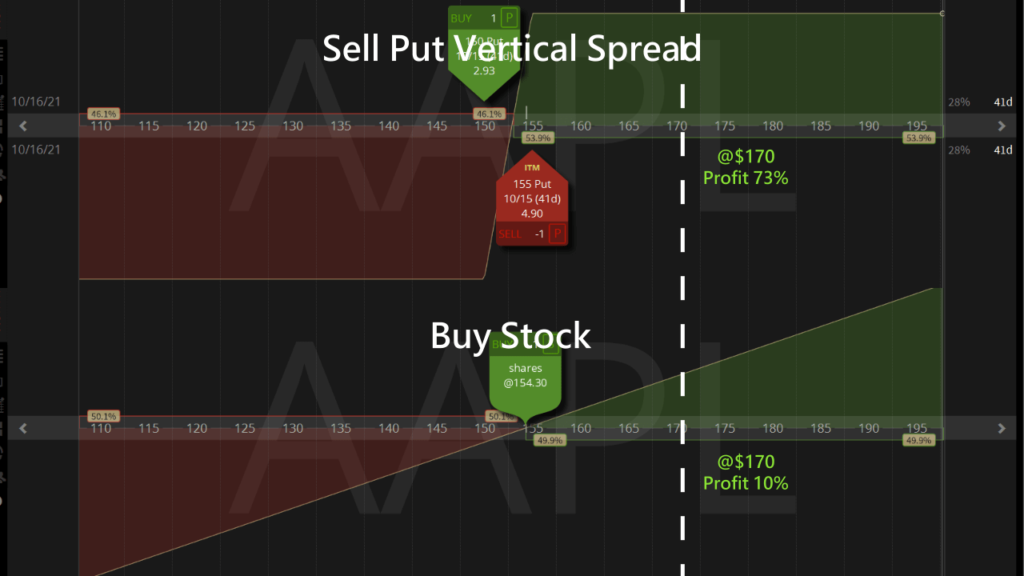
If AAPL price goes up by 10% in 41 days, we gain 10% profit from a stock trade, while a Bull Put Spread gains 73% return.
If we are wrong about the price direction, the Bull Put Spread loses 100% of the Buying Power.
What Are the Key Points to Profitable Bull Put Spreads?
When selling Put Spreads, we have a positive delta, so we want the stock price to go up to decay the option value, then we can buy to close the trade.
Delta is the changes to options price with respect to changes in the underlying price.
A positive delta trade is profitable when the stock goes up, and the trade loses when the stock price drops. If the stock price stays above the short Put strike, we can wait for the options to expire worthless for a profit.
Maximum loss of a Bull Put Spread = width of the Put strikes x 100 - premium collected
Buying Power = maximum loss
So when the Put strikes' width stays the same, a higher delta leads to a higher premium, lower maximum loss and higher returns.
Let's look at two AAPL Bull Put Vertical Spreads with the same $5 widths.
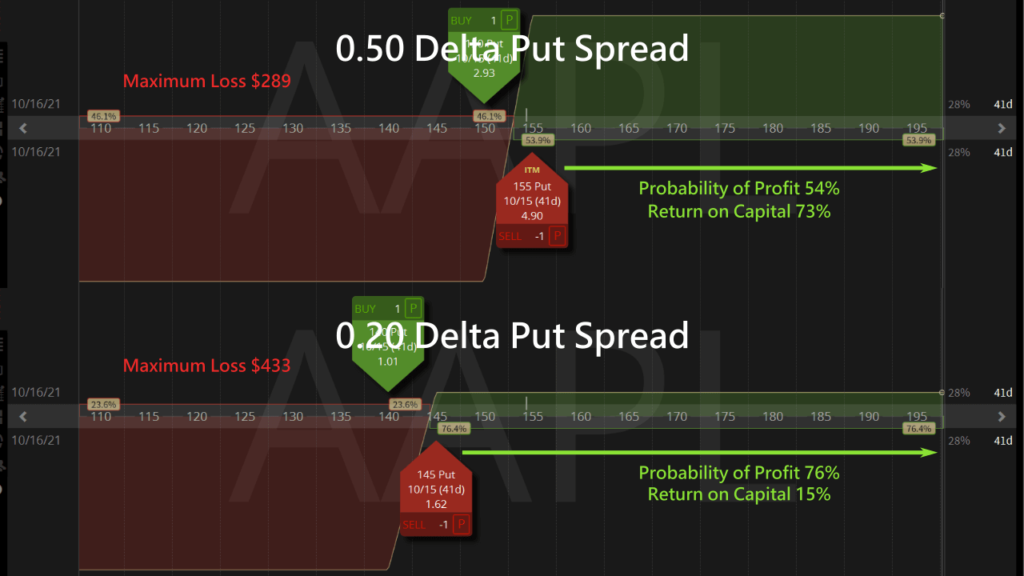
When the short Put is at 0.50 delta, the maximum return is 73%. When the short Put is at 0.20 delta, the maximum return is only 15%.

How to Use the Bull Put Spread Screener to Find Bottom Out Bullish Trades
The Bull Put Spread Screener uses historical chart analysis to find bottom out stocks that have a high probability of an upward correction that we can sell Bull Put Spreads to profit from the dip.
We want to find heavily undervalued, bottomed out underlying that have a high probability of going up.
- Long Days indicates the number of trading days since the most recent bullish signal, based on technical analysis. A small number means we can enter the trade at the start of the bullish trend.
- Long Signal Price shows the recent dip based on technical analysis. We can be confident the stock price will not fall below this price level in the short term.
- Fundamental analysis shows us the Fair Value of the underlying. Then it compares with the Last value to find the potential Upside. The higher the Upside, the greater the confidence of the stock being undervalued.
We can combine the 3 bullish signals in the screener to execute high probability bullish trades. The screener also helps us find high Return on Capital 0.50 delta ATM Bull Put Spreads.
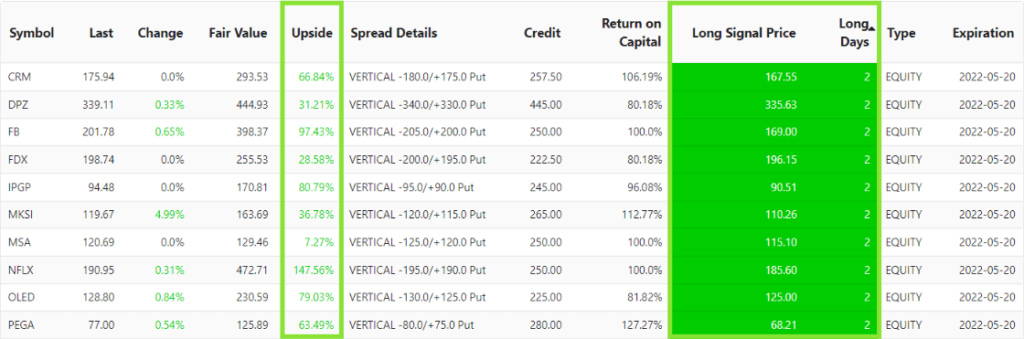
Then we can use the Spread Details to find the ATM Bull Put Spreads with the respective Return on Capital.
The Best Bottom Out Bull Put Spread Right Now
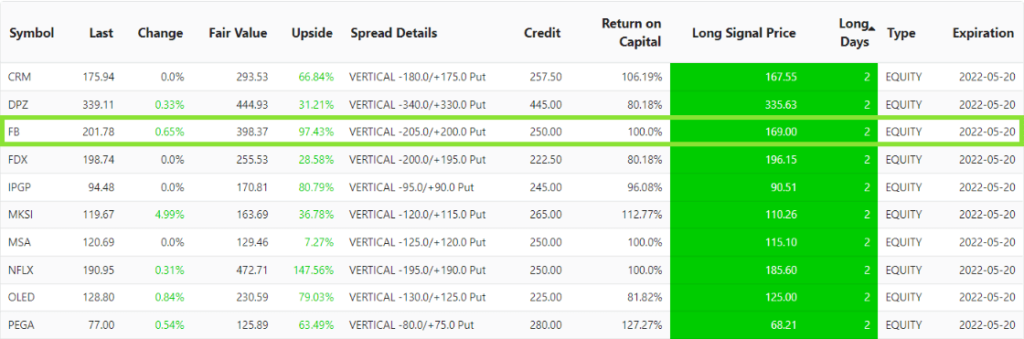
Let's pick the highest probability and high return Bull Put Vertical Spread entry points.
By combining Long Days and Upside, out of all bullish stocks that started within 2 trading days, FB is extremely undervalued with 97% upside. So it has a high probability of a bullish trend.
The FB price chart shows it reached a low point at Long Signal Price of $169 2 trading days ago, and has been bullish ever since.
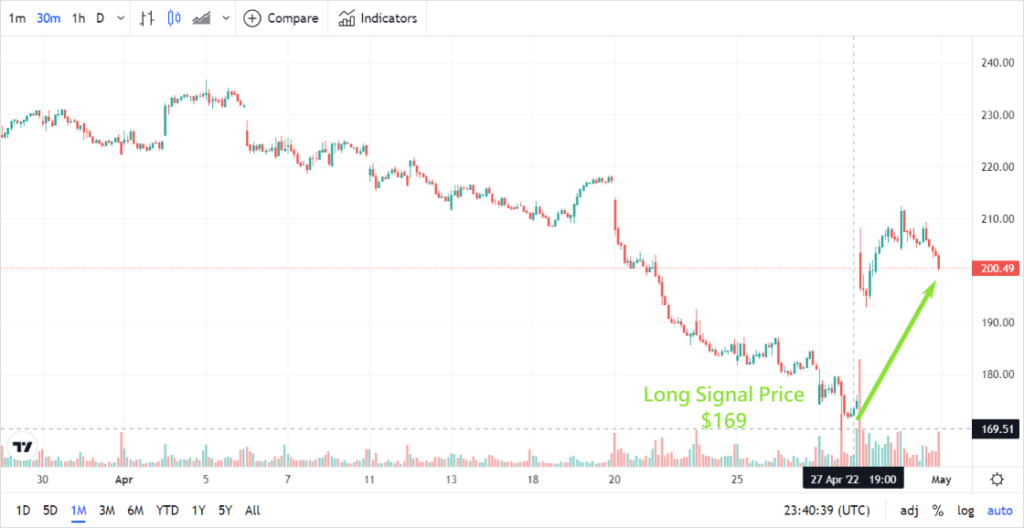
Considering FB is heavily undervalued, we can be confident of a bullish outlook.
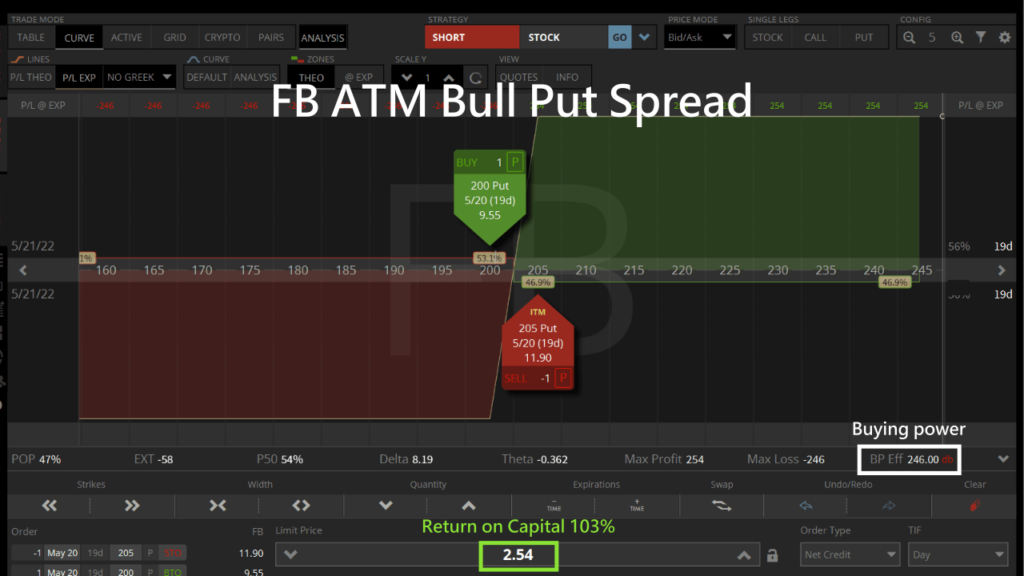
We can sell a FB Bull Put Spread option that expires next month. If the Meta stock price does not fall before expiration, we can profit 103% from the trade.
Now you know how to use the Bull Put Spread Screener to find bottomed out stocks that are trending upwards. Remember to use the screener often to find the best bullish Put Spreads to sell and profit from the rising trend.
How to Roll a Bull Put Vertical Spread?
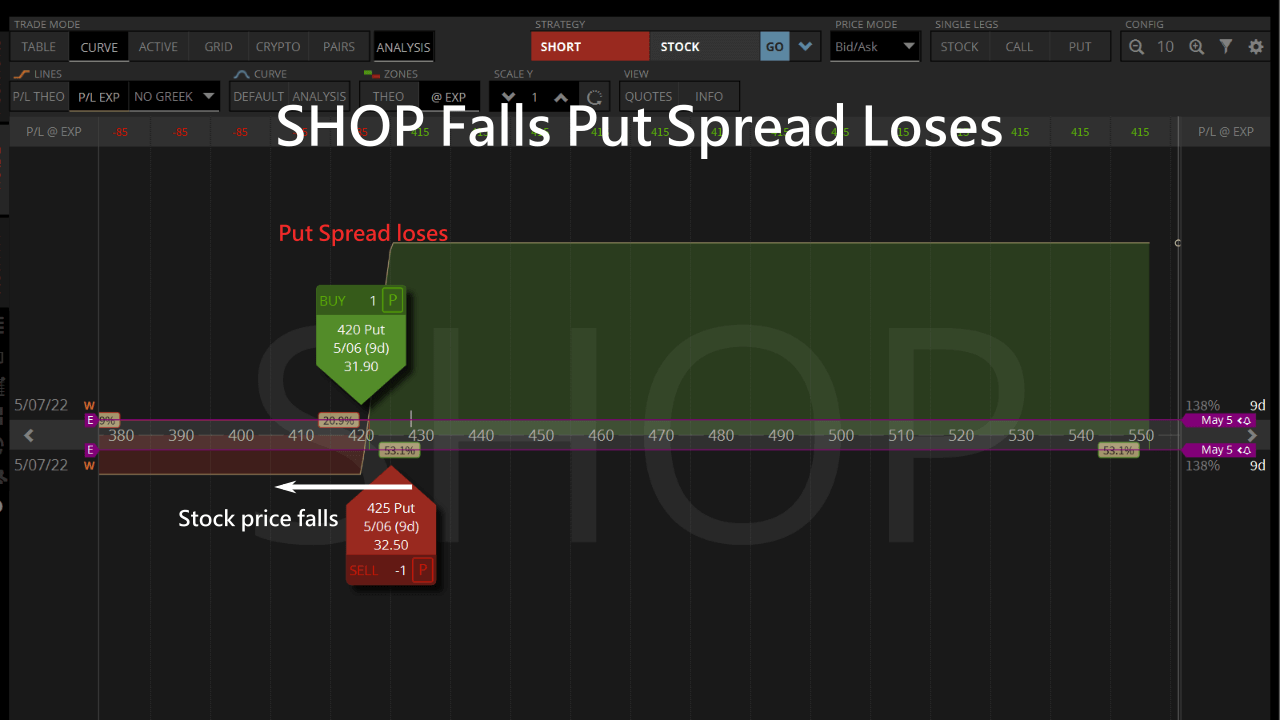
If the stock price is down with less than 14 days to expiration, we can roll the losing Put Vertical Spread to next month and wait for the stock price to rise in the future.
If the SHOP Bull Put Spread loses money because the stock price goes down, but we still think the stock price will bounce back up, we can defer the contract.
When rolling a Bull Put Spread, we need to close the existing Put Credit Spread, and sell to open a new Put Spread that expires next month.
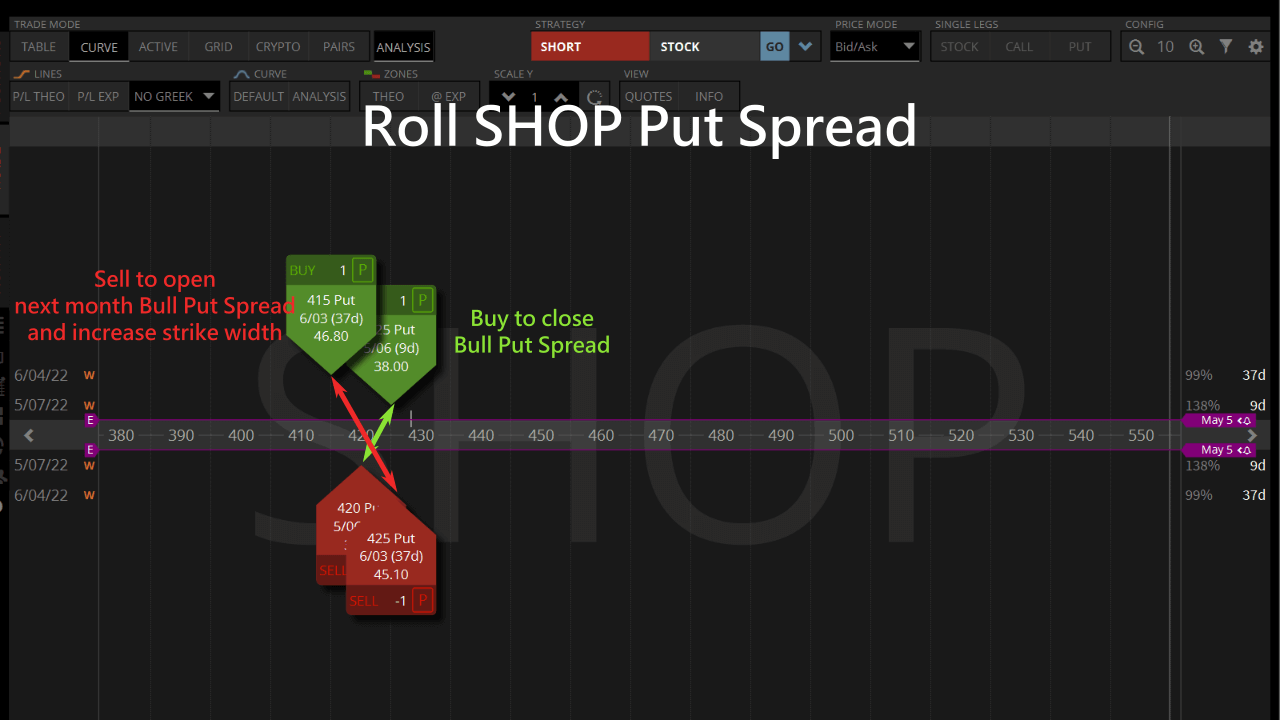
We can consider widening the Put Spread to increase the premium received to offset our existing losses.
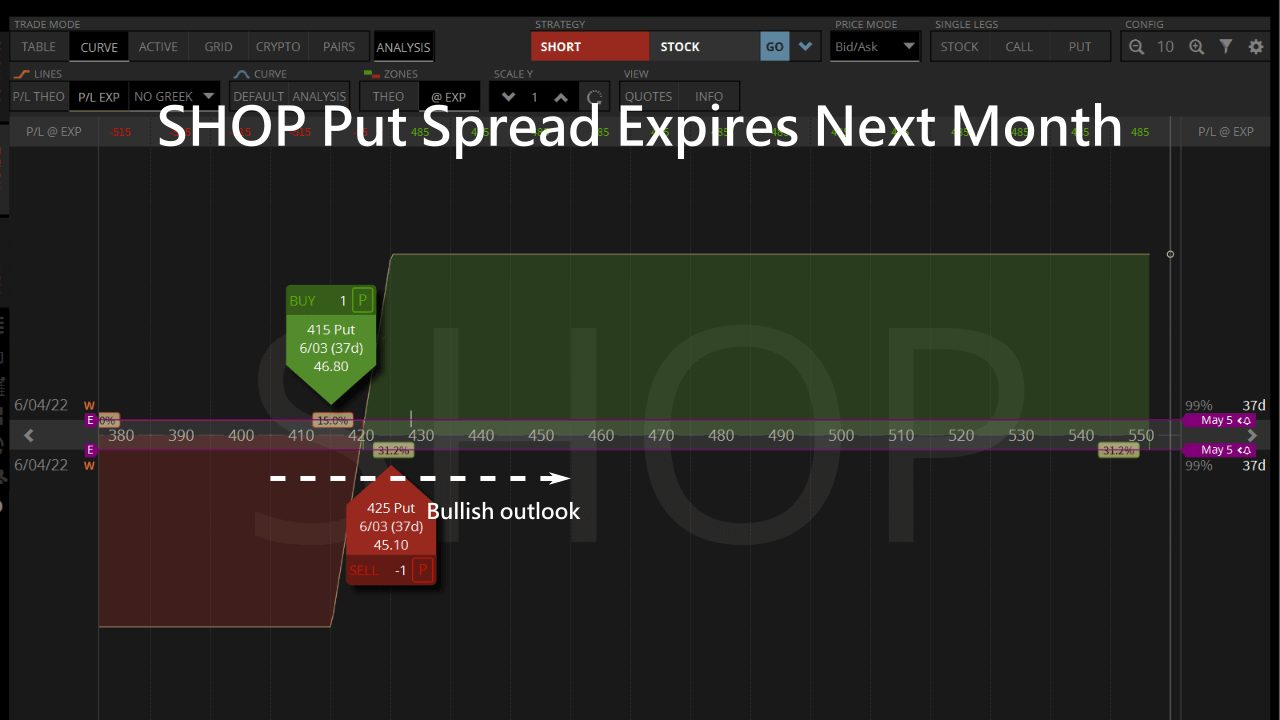
As a result, we create a longer date Bull Put Credit Spread with additional credit from longer time value and wider strike prices. Then we can wait for the SHOP stock price to bounce back in a bullish manner and profit from the new trade.
Unbox the SlashTraders Strategies That Outperform the S&P 500 by 450%
Hi, I'm a newbie. May I know why I am selling put spread instead of buying call spread? Thank you.
This is because selling Put Spread is profitable as long as the stock price doesn't fall, while buying Call Spread is profitable only if the stock price rises.
Put Spread is more likely to be profitable, even if the stock price does not move.
Hello, I'd like to ask you about this reply.
Take today as an example, if I want to construct a bullish NVDA spread for 2025/3/28 expiry of 115/125, I will use vertical call / put to construct the spread respectively.
Day's closing price NVDA $121.67
A.
NVDA 115 call = 9.20$ delta = 0.7232
NVDA 125 call = 3.65$ delta = 0.4221
Buy a 115call Sell a 125call -> Payout (9.2-3.65)*100 = 560$ Max Profit 425$ Max Loss 575$ (This is what I pulled with Futura Bull)
delta = 0.3010
B.
NVDA 115 put = 2.45$ delta = -0.2809
NVDA 125 put = 6.84$ delta = -0.5752
Sell one 125put Buy one 115put -> Receive premium (6.84-2.45) = 439$ Max Profit 439$ Max Loss 561$
delta = 0.2943
I would like to ask if it looks like these two things are pretty much the same? The max profit/loss part is very close, as if the only difference is whether you pay or receive royalties up front?
1. Is it because the option strategy will not be held to maturity? So in this case, the first to collect the premium will be the first to earn?
2. In this case, if the stock price does not move
At expiration, A's 115call can buy 100 shares and sell them at 121.67 -> earn (121.67-115)*100=667$, deducting the 560 originally paid, you still earn 107$.
B's 125put will execute the portion of loss (125-121.67)*100=333$ -> plus the $439 originally taken equals an actual gain of $106.
Does it look like it's about the same?
3. Or am I wrong in my thinking that the vertical spread should be the put/call of the selling ATM, so I should put the
A amend to sell 121 call buy 131call
B, change it to sell 121 put, buy 111 put, and that's the original context of the discussion?
Thanks for clearing that up!!!
You're right, A and B look pretty much the same, it's just a matter of whether you get paid first (seller) or pay first (buyer).
However, considering theta decay, the value of the option slowly depreciates with the passage of time, and the seller will have the advantage of time because of theta decay.
So when we are bullish, we sell Put spread and when we are bearish, we sell Call spread.
It is also common to use a cutoff of 30 days or more, theta decay is more stabilizing
Hi Tony.
Unable to view long days under Bull Put screener.
Currently not showing any days. Could you please check.
Thanks.
Sai
Hi Sai.
The long days are available now.
You probably checked the screener during the time our software was recalculating, hence the data wasn't available.
Cheers.
With your recent KMX trade with an expiry of 11-17, are you worried about earnings on 9-28 and the effect on IV? Just curious as to your methodology & timing decision Just curious as to your methodology & timing decision.
We are not very concerned about earnings. You never know what happens at earnings. Earnings result might be bad but stock goes up or vice versa. algorithm is based on long-term price action. The reason there is a long signal is that there has been a constant accumulation of the stock on higher timeframes. The stock is undervalued and has substantial upside potential fundamentally. If we get assigned because our Put will be pushed deep into the money, we are not concerned because we are not in the market for the stock. If we get assigned because our Put will be pushed deep into the money, we are not concerned because we will retain the premium and hold the stock till it moves upward eventually.
hello Tony can you help how to use the scanner for selling put option around 12 delta for some premium regards
You can use the Bull Put Spread Screener and sell 12 delta Puts when a symbol has a large Upside and Long Days as 1.
Thanks for sharing how to find good Call Put vertical spread trades with Stock Pickers!
Hi, thanks for sharing this. I am also exploring this strategy to compliment other strategies. One question on the Baba example, from the screenshot, the sell put premium is 9.75 and buy put premium is 10.40. One question on the Baba example, from the screenshot, the sell put premium is 9.75 and buy put premium is 10.40. With this, isn't that it's loss of 1.17(9.75 (premium we gotten from sell put) - 10.40(premium we paid to buy put)? With this, isn't that it's loss of 1.17(9.75 (premium we gotten from sell put) - 10.40(premium we paid to buy put)?
You are right that the quote of the short Put premium (9.75) seemed to be lower than the long Put (10.40), leading to a theoretical 0.65 debit.
But the actual calculation of the combined trade, due to the bid-ask spreads, the platform still gave me a positive net credit of 1.17 (as seen in the bottom right Order Type as Net Credit).
Thank you for the tutorial to help me consistently buy the dip
happy to help
Loving your algorithms for picking high probability bullish put spreads!
Thank you
Thank you for sharing the ways to trade vertical spread options
You're welcome.
What are the best stocks are vertical spreads?
We believe the best stocks for bull Put vertical spreads are whichever stocks that satisfy both "undervalue" criteria.
Fundamentally at least 30% undervalued, as described by the Fair Value and Upside columns of our scanner.
Technically undervalued as our Trends and Long Signal columns indicate a bottomed out event has happened recently.
May I ask, since 10/28. the stock price of BUD you traded has reached $63, but the put vertical (55/56) P/L day (-126/98) in your trading account is a loss of 28$. Isn't it true that if the stock price is greater than $56, you will make money? I don't understand. Thank you for your help.
Hello, we have listed two P/Ls with the following differences:
P/L Open - profit/loss from the start of the trade to the present day
P/L Day - Today's Profit/Loss
As you mentioned on 10/28 the BUD was $63 and the 55/56 Put Spread trade should have been positive!
From the P/L Open it looks positive (-278+376=98) for a profit of 98$.
The P/L Day loss of $28 you see is due to the "day's" stock price fluctuations that caused the "day's loss".
However, the P/L Open accumulation was positive from the beginning of the trade, so it's correct.
It turns out that bullish trades can still be done with vertical spreads.
I've learned and earned it.
Yeah, trading options is a lot more leveraged than stocks.
However, be aware that if the stock trend forecast is wrong, the purchasing power used will go to zero.
Therefore, we combine fundamental and technical analysis to find the highest probability of bottoming before entering the market.
wow, this is a great insight into selling bull put vertical spreads
thanks
Thanks, we believe our system can consistently find bottom out stocks to trade.
Wait, are you saying the bull put spread screener can find bottom out stocks consistently?
I can't wait to check it out!
Yes, please give it a try!
I have two questions.
1 do is high price sell put, already directly compared to buy the stock expensive 2. BABA 41 days after the cut-off price level bullish Put vertical spread has the highest 31% ROI. How is this 31% calculated?
Thank you for your question.
1. If you think the stock has bottomed out and is going to go up, it is better to sell Put prices that are a little higher than the stock price, which can reduce the buying power of the whole transaction, minimize the maximum loss, and increase the rate of return on investment.
2. In the article sold Bull Put Spread income is $1.17 × 100 = $117, using $383 buying power purchasing power, if after 41 days the stock price is above $175, sold Bull Put Spread will be invalidated, the income is $117. Return on Investment 117/383=31%
Thank you for sharing How to Search for Stocks that Bottom Out
Subscribed member, looking forward to trading up using the call list!
You're welcome.