

When most investors turn bullish on a stock, they think of only one thing: buy the shares and wait for the price to rise. But this approach has two problems — you must commit the full capital, and you only make money if the stock actually goes up. If the price goes nowhere for three months, your capital sits locked up for three months and earns you nothing.
A bull Put spread offers another path: you collect the premium up front, and as long as the stock stays above the level you chose at expiration — rising, flat, or even drifting slightly lower — that premium is yours to keep. Your risk is locked to a known number from the moment you enter, and the margin required is typically less than one tenth of buying the shares outright.
But the strategy has one prerequisite: you must find stocks that are genuinely at the start of an upward move. This is exactly where most traders fail — they guess at the bottom by feel and end up selling Put spreads halfway down a decline. The SlashTraders Bull Put Spread Screener solves this with an algorithm: it scans the market daily, surfaces the stocks that have just triggered a bottoming signal, and calculates the spread setup and return on capital for you.
Since 2022, SlashTraders has run a math-based options income system on a fully transparent trading account — every trade, every loss, and every commission published in real time via API. The screening process shared in this article is exactly what we use to find bull Put spread opportunities.
What Is a Bull Put Spread?
A bull Put spread is a premium-collecting options strategy built from two legs: sell a Put at a higher strike and simultaneously buy a Put at a lower strike with the same expiration. The short leg is what pays you the premium; the long leg is your insurance — it caps your maximum loss at the distance between the two strikes, so you never face the open-ended risk of a naked Put.
- Short leg (Short Put): sell the higher-strike Put — this is where your premium comes from. The closer the strike sits to the current price, the more premium you collect, but the higher the probability the stock falls below it.
- Long leg (Long Put): buy the lower-strike Put with the same expiration as insurance. The distance between the two strikes — the spread width — determines both your maximum loss and the margin your broker requires.
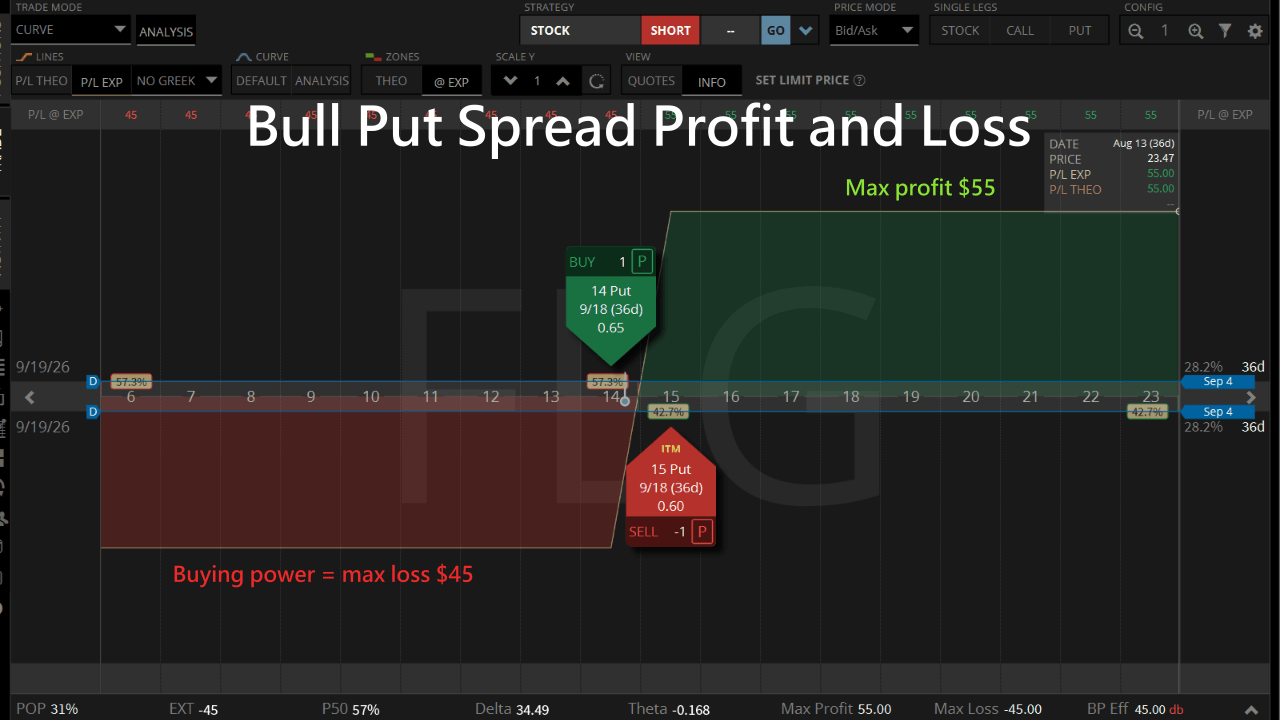
The math is refreshingly simple: maximum profit equals the net credit received; maximum loss equals the spread width times 100 minus the net credit; return on capital equals maximum profit divided by maximum loss.
For example, selling a $1-wide Put spread for a $55 credit gives a maximum loss of $100 − $55 = $45, and a return on capital of $55 ÷ $45 = 122%.
Why a Bull Put Spread Fits Bullish Trends So Well
Buying stock gives you exactly one way to make money: the price goes up. A bull Put spread gives you three: the price goes up, the price goes sideways, or the price drifts down without breaking your strike. That difference sounds small but it dramatically raises your win rate — you no longer need to predict how far a stock will rise, only how far it will not fall.
- Risk is fully defined: from the moment you enter, you know the worst-case number. You do not need a stop loss, and an overnight gap cannot force you out at the worst possible price.
- Capital efficiency is extreme: on a stock trading at $105, buying 100 shares costs $10,500. Selling a $5-wide Put spread for a $285 credit ties up just $215 in margin — roughly 49 times less capital.
- Time works for you: this is a net credit position with positive Theta. As long as the stock stays above your strike, the mere passage of time earns you money every single day — an advantage stock ownership simply does not have.
Why You Need a Screener Instead of Guessing the Bottom
The mechanics of a bull Put spread are not difficult — the timing is. There is really only one scenario that destroys this strategy: you sell a Put spread halfway down a decline, the stock keeps falling, and you exit at maximum loss. A trade that collects $200 and loses $300 only needs to happen a few times in a row to wipe out an entire year of income.
Avoiding that trap means confirming three things at once: whether the stock is near a short-term bottom, whether implied volatility is high enough to make the premium worth collecting, and whether the risk-reward ratio actually stacks up. Checking one stock by hand takes ten or fifteen minutes; scanning the whole market by hand is impossible. That is precisely what a screener is for.
How to Read the Bull Put Spread Screener
Open the SlashTraders Bull Put Spread Screener and you will find the system has already calculated a complete spread setup for every stock — how much premium to collect, what the return would be, and where the algorithm believes the bottom sits. Here is what each column means and how to use it:
| Symbol | Last | Spread Details | Credit | Return on Capital | Long Signal Price | Long Days | Change Since Signal |
|---|---|---|---|---|---|---|---|
| ELV | $398.22 | VERTICAL -400/+390 Put | $610 | 156.4% | $391.24 | 8 | 1.78% |
| PPG | $114.73 | VERTICAL -115/+110 Put | $152.50 | 43.88% | $109.84 | 11 | 4.45% |
| EMN | $73.77 | VERTICAL -75/+70 Put | $230 | 85.19% | $66.98 | 45 | 1.75% |
| CHD | $101.32 | VERTICAL -105/+100 Put | $200 | 66.67% | $90.42 | 82 | 5.28% |
- Spread Details: the setup the system suggests. For example, "VERTICAL -170.0/+165.0 Put" means sell the 170 Put and buy the 165 Put, a $5-wide spread. The minus sign marks the leg you sell, the plus sign the leg you buy.
- Credit: the net premium you would receive for opening the spread at current market prices — in other words, your maximum profit.
- Return on Capital: the return equals Credit divided by maximum loss. It tells you how much each dollar of margin earns over a typical 30–45 day holding period. For the same holding time, a higher return deserves a closer look.
- Long Signal Price: the bottoming price calculated by the algorithm, representing the level the stock has a high probability of staying above in the near term. This is the single most important reference line when choosing your strike.
- Long Days: how many trading days have passed since the last bottoming or long signal fired. The smaller the number, the fresher the signal and the more of the rebound is still ahead of you.
- Change Since Signal: how much the stock has moved since the signal fired. If this number is already large (say above 10%), much of the upside may be behind you; if it is negative, the stock has kept falling since the signal and warrants extra caution.
Four Steps to Find Trades With the Bull Put Spread Screener
Here is the process we actually use. From opening the list to submitting the order, it takes about ten minutes once you are familiar with it.
Step 1 — Filter for the Freshest Signals
The first column to look at is Long Days. It tells you how many trading days have passed since the bottoming signal fired — in other words, how fresh the opportunity still is. When a signal has just fired, the stock is usually still consolidating near its low, which is the ideal moment to open a bull Put spread.
- Long Days within 10: the signal is fresh, the upward move has just begun, and you have a full 30–45 day cycle for the position to work.
- Change Since Signal between 0% and 8%: the stock has started responding to the signal (confirming the bottom held) but has not run too far, so the premium is still worth collecting.
- Skip names where Change Since Signal is clearly negative: the stock has kept falling since the signal, which suggests the bottom has not actually formed. Entering here is catching a falling knife.
Step 2 — Use the Long Signal Price to Choose Your Strike
The Long Signal Price is the most valuable column on the list. It tells you where the algorithm places the short-term low, and your goal is simple: keep your short Put strike below that price. That way, even if the stock retests its bottom, your position stays safe.
One caveat: the list defaults to at-the-money spreads because those produce the highest return on capital. But an ATM spread only wins about half the time — which is exactly why you see returns above 100%. If you want a higher win rate, shift both strikes down below the Long Signal Price and trade a smaller Credit for a much better probability of profit.
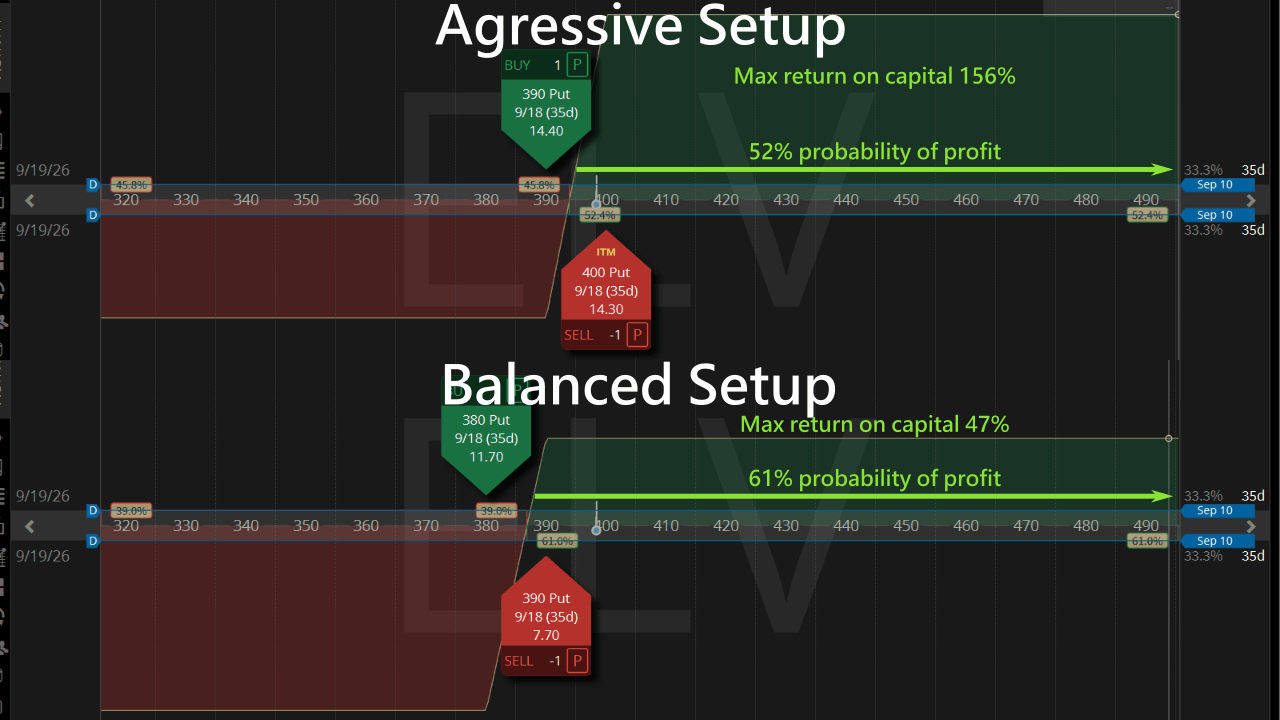
- Aggressive setup: take the at-the-money spread the list suggests, delta around 0.45–0.50, win rate roughly 50–55%, return on capital above 100%. Only appropriate when you have high conviction in the signal and keep position size tightly controlled.
- Balanced setup: short Put strike near the Long Signal Price, delta around 0.30, win rate roughly 70%, return on capital 30–50%. Suitable when you trust the signal but still want a buffer.
Step 3 — Confirm No Earnings Report Before Expiration
Check the earnings date: make sure no earnings report falls before expiration. Any time earnings miss market expectations the stock swings hard and can move against the direction you were positioned for, which is why earnings are the most common way a Put spread blows up — a single gap can erase several months of accumulated income.
Step 4 — Write Your Exit Rules Before You Submit the Order
The single biggest mistake options sellers make is entering without deciding how they will exit. The value of a spread changes every day, and without written rules you will get greedy when you should take profit and hopeful when you should cut the loss. Before you hit submit, write down these four rules:
- Take profit: close the position when the spread has decayed to 50% of the original credit. Capturing half the profit in far less than half the time frees your capital for the next trade and produces a higher annualised return.
- Stop loss: close the position when the unrealised loss reaches twice the credit received. This rule ensures a single trade never reaches maximum loss and keeps your win rate and payoff ratio in calculable territory.
- Handling expiration week: with 7–10 days left and the stock near your short strike, either roll to the next monthly expiration at a lower strike, or close for a loss. Do not hold into expiration and expose yourself to early assignment.
- Position sizing: keep the maximum loss on any single trade below 2% of your account value. This is the one rule that keeps you in the market after a string of losses, and in our view it is the most important rule in this entire article.

Real Examples: Two Opportunities From the Screener
Open the SlashTraders Bull Put Spread Screener and sort by Long Days from smallest to largest, and within seconds you will see the stocks that triggered a bottoming signal today.
| Symbol | Last | Spread Details | Credit | Return on Capital | Long Signal Price | Long Days | Change Since Signal |
|---|---|---|---|---|---|---|---|
| ELV | $398.22 | VERTICAL -400/+390 Put | $610 | 156.4% | $391.24 | 8 | 1.78% |
| PPG | $114.73 | VERTICAL -115/+110 Put | $152.50 | 43.88% | $109.84 | 11 | 4.45% |
| EMN | $73.77 | VERTICAL -75/+70 Put | $230 | 85.19% | $66.98 | 45 | 1.75% |
| CHD | $101.32 | VERTICAL -105/+100 Put | $200 | 66.67% | $90.42 | 82 | 5.28% |
On the list, ELV and PPG triggered their bottoming signals 8 and 11 days ago and have already risen 1.78% and 4.45% respectively. Opening a bull Put spread now gives you a high probability of profiting from the upward trend that is already underway.
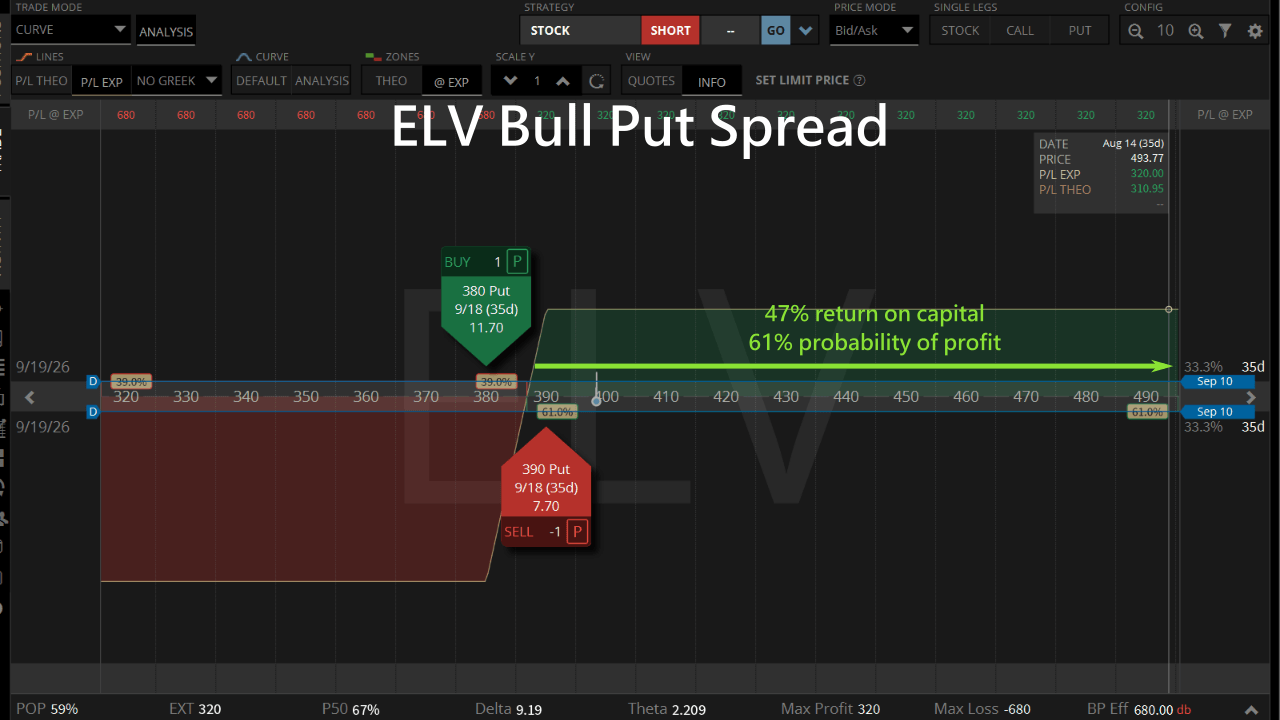
ELV's most aggressive ATM bull Put spread shows a 156% return on capital, but only a 50% probability of profit. We chose the balanced setup at a delta of roughly 0.20–0.30, which gives a 47% return on capital and a 61% probability of profit.
PPG's aggressive setup on the list shows a 43% return on capital, but again with only about a coin-flip chance of profit. Switching to the balanced setup gives a 25% return on capital and lifts the probability of profit to 68%, so small moves in the stock price are nothing to worry about.

Risk Management for Bull Put Spreads
The payoff profile of this strategy is many small wins punctuated by the occasional large loss. A single maximum loss can be two to five times the credit collected, so long-term profitability depends entirely on how disciplined you are about controlling those few losing trades. Here are the three rules we actually follow:
- Always use a spread, never a naked Put: the long leg usually costs only a fraction of the premium you collect, yet it converts the worst case from "the stock goes to zero" into a small fixed number. That insurance is always worth paying for.
- Diversify across uncorrelated names: do not open five positions in semiconductor stocks in the same week. Bull Put spreads all suffer together in a broad market decline, and the only defence is spreading positions across different sectors and actively reducing total exposure when market sentiment clearly weakens.
- Treat losses as a cost, not a failure: if your win rate is 75%, then one in every four trades loses. That is part of the design of the strategy, not an execution error. The actual mistake is deciding to "wait one more day" when your stop rule has already triggered.
Three Most Common Mistakes
- Picking trades on return alone: almost every spread showing a return above 100% is an at-the-money setup, which means it wins only about half the time. What actually drives long-term performance is win rate multiplied by return, not the biggest percentage on the list.
- Ignoring Long Days and entering after the signal has gone stale: opening a position 30 days after the bottoming signal means selling Puts at the tail end of the rebound, where the risk-reward is nothing like it was at the start. The column exists precisely so you can avoid this trap.
- Sizing up after a winning streak: this is the classic way options sellers end their run. Eight wins in a row, double the size, and the ninth trade gaps down on earnings and erases everything that came before. Position size should be determined by account value, not by how hot you feel.
Who Is the Bull Put Spread Best Suited For?
This strategy suits three kinds of investors: first, those with limited account capital who still want exposure to a stock they are bullish on; second, those already selling cash-secured Puts who want to do the same thing with far less margin; third, those who are comfortable with a payoff profile of many small wins and the occasional large loss, and who will enforce position sizing rigorously.
Conversely, if you cannot stomach a single trade losing two or three times the premium collected, or if you would actually like to be assigned and hold the shares long term while selling covered calls, a cash-secured Put is the better fit. It requires more capital but places far less psychological strain on you.
A bull Put spread is not a complicated strategy — two legs, four numbers, a fixed maximum loss. The real difficulty is finding the right stock at the right moment. Traders who guess at bottoms will eventually sell Put spreads into a downtrend; traders who screen with data keep collecting premium at algorithm-confirmed rebound points. The difference is invisible on any single trade, but over a full year it is the line between profit and loss.
SlashTraders vs S&P 500: 450% Outperformance, Verified Trades and How to Copy Every Alert