Do you regret missing out on the low point of TSMC's stock price?
Did the recent fluctuation of TSM make you unsure of the future price trends?
Today I'll share with you how to trade options to increase leverage on TSM trades, and be profitable no matter which direction the price goes.
We don't talk about business and financial news here, we just analyse the the price charts and let the data tell us how and when to trade TSMC.
Contents
Why Do You Want to Invest in TSMC?
You might wonder what's the point off trading in TSMC's ADR if you can buy the same stock in Taiwan's stock market?
Well, the US stock market lets you trade options, not just stocks, so you have the additional flexibility to trade options through TSMC's ADR in the US stock market.
Why Trade Options?
You might also wonder what's the point of trading options? Is it more complicated than trading stocks?
In simple terms, trading stocks is only profitable when you guess the direction of price right, either up or down, so you only have a 50% chance of profitability. The directional change also needs to be large enough to make your profit worthwhile.
On the other hand, options trading allows you to create a price range that has >50% chance of profitability and be profitable as long as the stock price stays within that range.
| Strategies | Market direction | Return on capital | Probability of profit |
|---|---|---|---|
| Stocks | Either up or down | Larger fluctuation leads to larger return | 50% |
| Options | Create a profitable price range | Premium/Buying Power depends on the strike price and time to expiration | >50% |
You can say trading stocks is suitable for investing long term in valuable companies by fundamental analysis, while options trading is suitable for taking advantage of short term trends based on chart analysis.
TSM Price Trends in the Past Year
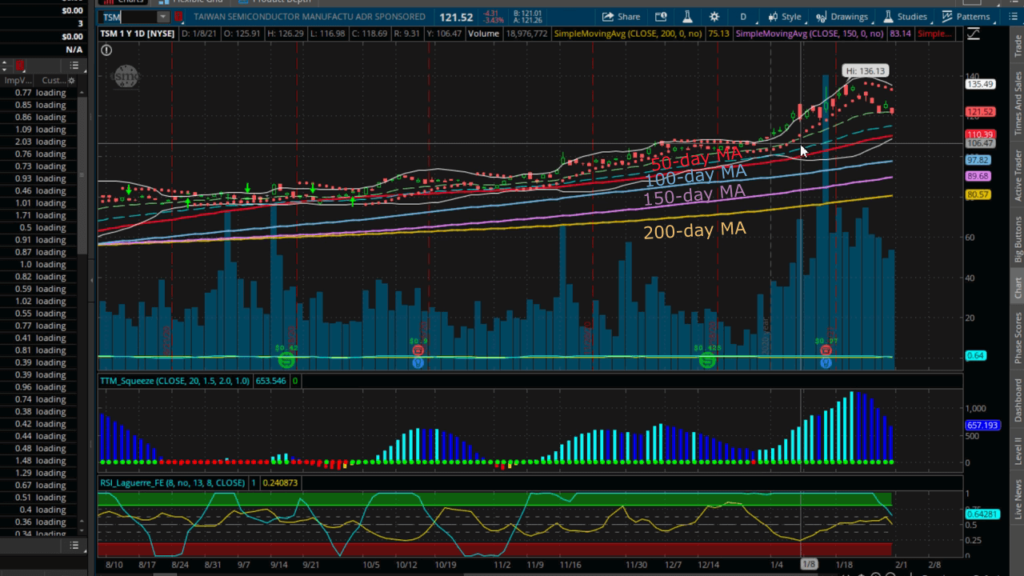
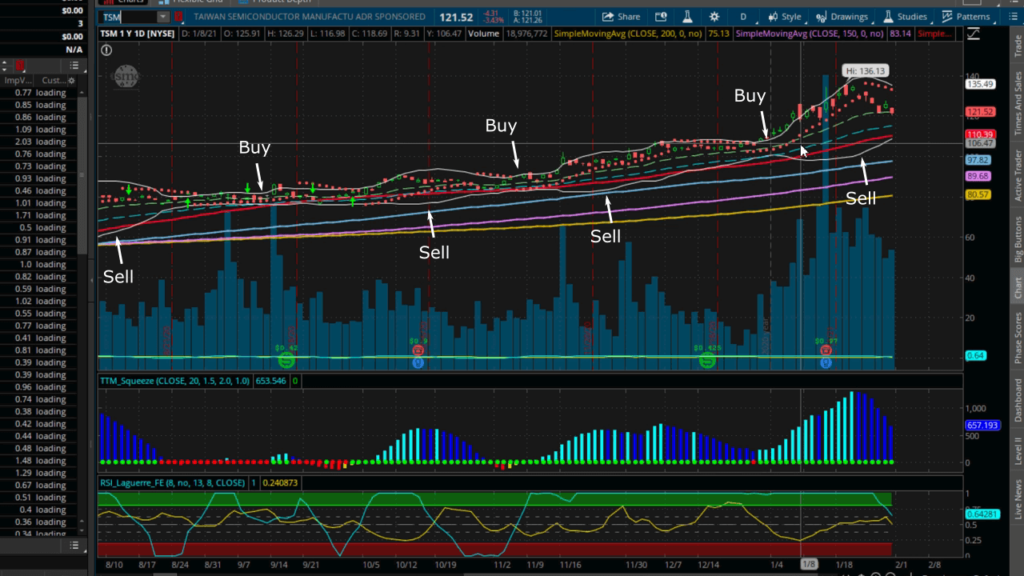
Based on the price chart of TSM from last year, shown in TD Ameritrade, all of the 50-day, 100-day, 150-day, 200-day moving averages were trending upwards. We can tell TSMC is financially strong and competitive like Apple.
Based on the gradients of the moving averages, we expect the TSM stock price to increase by $10-15/month.
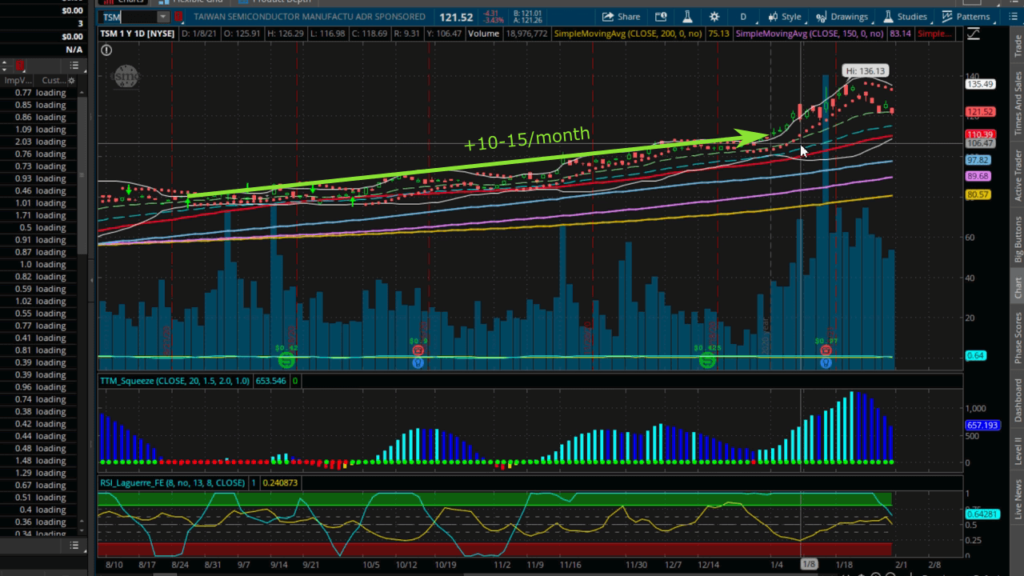
If you were perfectly timed to purchase TSM stocks last March at $42.7/stock, your shares would have increased by 200% in the past year. But since you are still reading this article, very likely you missed out on the $42 shares, and are wondering if it's too late to trade TSM.
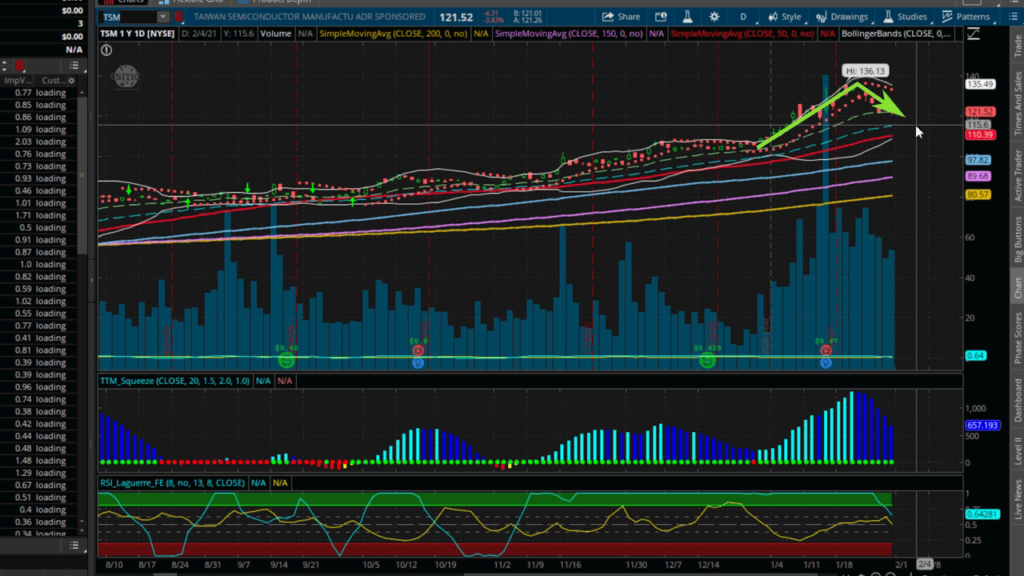
TSM stock prices also experienced both rapid rises and big plunges in the past few weeks, leading to great uncertainly in the long term price trends.
How to Predict Stock Price Trends With Implied Volatility (IV)?
You can tell from TSM's Implied Volatility (IV) that right now IV Percentile is >70%, meaning the IV is larger than 70% of the trading days in the past year, as more people are wary of the recent price changes, and expect the price to move a lot in the near future. So more people are trading options as more people expect changes to the stock price.
Higher IV correlates to higher options prices (premium), so right now is a good time to be an options seller. As IV Percentile is at a high level, there is also a greater likelihood that IV will reduce in the near future, giving us more opportunity to close the options trade when the premium drops.
So our goal is to sell options when IV and premium is high, and close the trade when IV and premium is low.

What Are Bollinger Bands?
Bollinger Bands are used to monitor changes in IV, and indirectly monitor the expected move of stock prices.
The Bollinger Bands settings we use are 20-day moving average and +/-2 standard deviations.
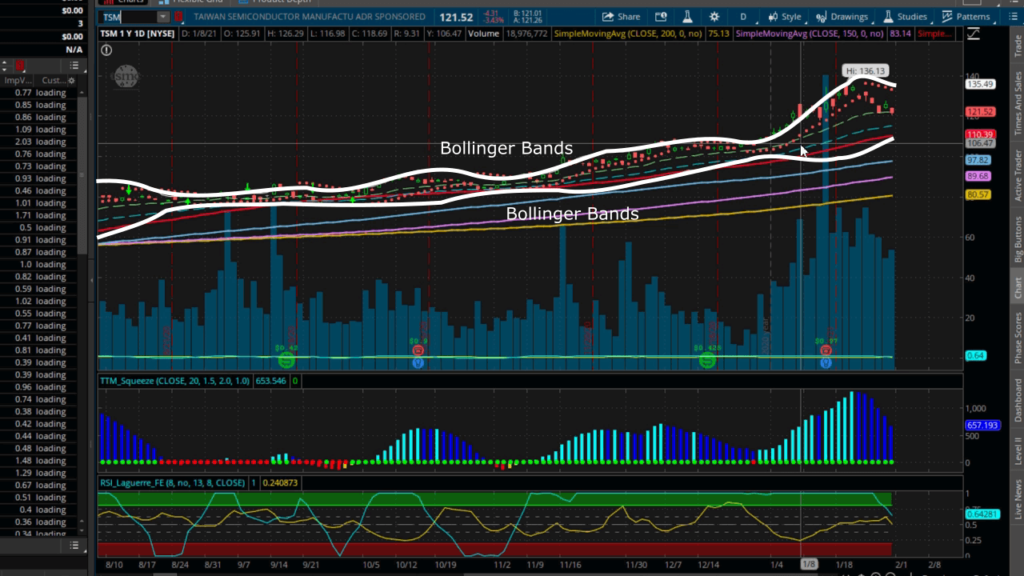
By recalling the normal distribution in high school statistics, we know there is 95.4% probability of the sample staying within +/-2 standard deviations.
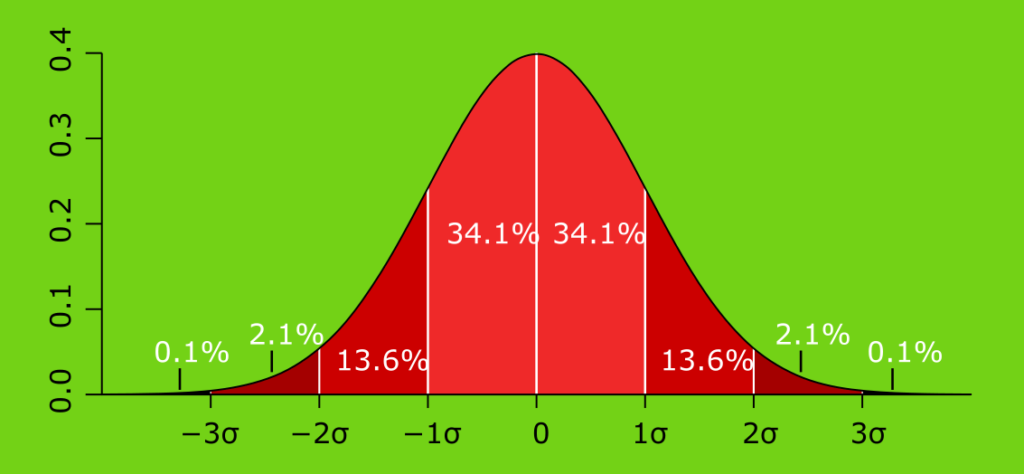
So we can use the Bollinger Bands to predict where the stock prices will likely move in the near future, and indirectly monitor the relative levels of IV.
How to Be Profitable Trading TSM No Matter the Stock Prices Rise or Fall?
Since we can predict the range of possible price moves using Bollinger Bands, we can sell options when the premium is higher during a wider band.
Then we can close the trade when the Bollinger Bands contact in the future.
Since we can't be sure whether TSM stock prices will rise or fall, we can use the options screener to analyse an Iron Condor to define a profitable price range. If the stock prices stay within the price range before the option expires, our trade will be profitable.
| Symbol | Last | Fair value | Strangle details | Iron Condor ROC |
|---|---|---|---|---|
| TSM | 121.52 | 108.43 | C140(0.20) P100(-0.19) | 35.14% |
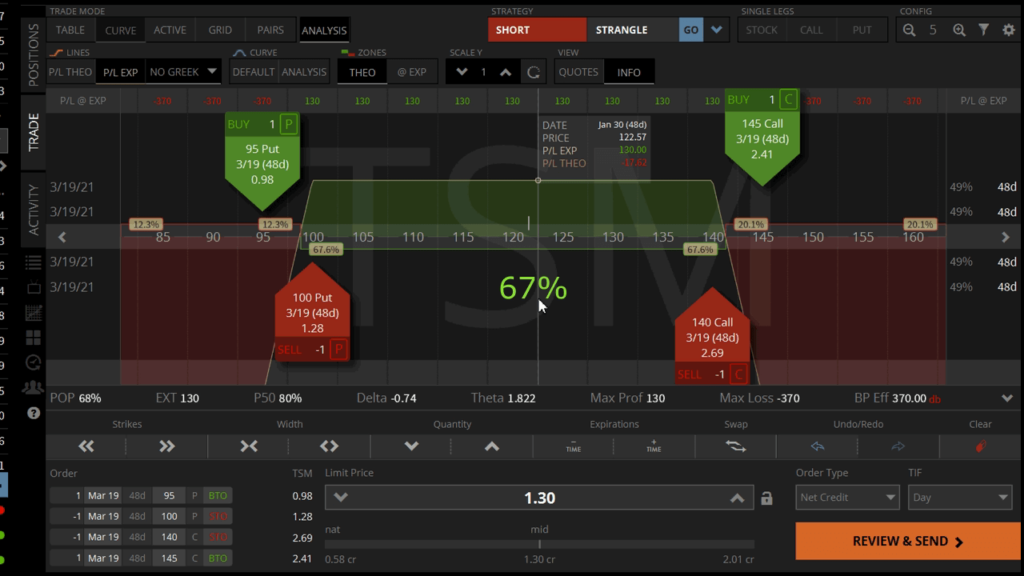
We can sell an Iron Condor based on the current chart analysis:
- Sell a $100 Put and a $140 Call to define a range of profitability
- Buy a $95 Put and a $145 Call to limit our losses
This trade has a 67.6% chance to expire worthless after 48 days.
And we will receive $130 premium through selling the Iron Condor.
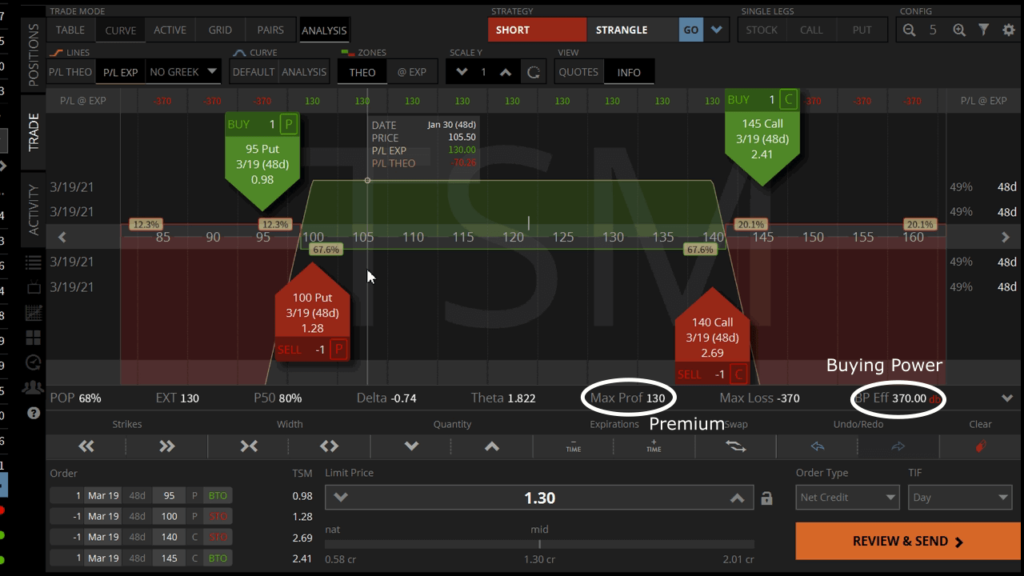
If TSM price doesn't fluctuate beyond the strike prices $100 and $140, the four option contracts will expire worthless, and we will make $130 profit from $370 Buying Power.
Even if the stock price fluctuates beyond the strike prices, we can still adjust the Iron Condor to minimise our maximum loss.
The Return on Capital of trading options is far greater than trading stocks in the short term.
Any options seller will tell you not to keep the contracts open through to expiration, but exit early:
- After you reach 50% profit
- 14 days before the expiration
This way you can minimise risks while maximise your chances of profit.
Subscribe to our membership to access all the unique stock scanners and receive real-time trade alert emails.
Trending Articles
- What Are Options Contracts and How Do They Work?
- Options Wheel Strategy to 3x Your S&P 500 ETF Return
- 3 Things We Hate About Selling Covered Calls
- How to Roll Options to Repair Losing Trades
- How to Setup Your Telegram Username? Get Real-Time Trade Alerts
- Trade Poor Man’s Covered Call if You Can’t Afford 100 Stocks