
Do you feel FOMO when you hear stories about Teslanaires, who struck gold by investing in TSLA early?
Do you want in on the action but don't know when Tesla stock will go up again?
We will show you how to analyse price trends to predict when Tesla stock will take off, or crash next.
Contents
Why Invest in Tesla?
Not only is Tesla the global market leader in electric vehicles, Tesla's solar division, formerly known as SolarCity, is also the largest solar installer in the US. So Tesla is synonymous with disruptive renewable technologies.

Whether it is SpaceX, The Boring Company, Paypal, Neuralink, OpenAI or other innovative companies, Elon Musk has demonstrated his midas touch and disrupted industries after industries.
Tesla's financial strength and stock performance has led it to be included in the S&P 500 index for the first time in late 2020. It is one of the most traded stocks on the market.
TSLA Stock Performance of the Past Year
Looking at TSLA's price trends from last year, we noticed the stock price reached a low of $70.1 during March 2020, then steadily climbed to $900, a 12x Return on Investment.
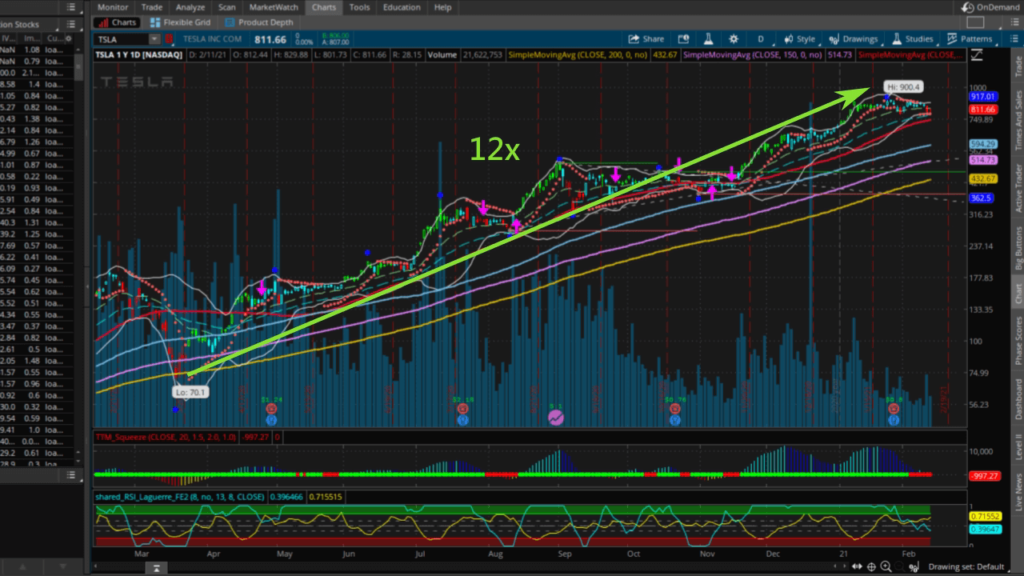
Everyone is wondering if TSLA will shoot past $1000 per share, and when will that happen?
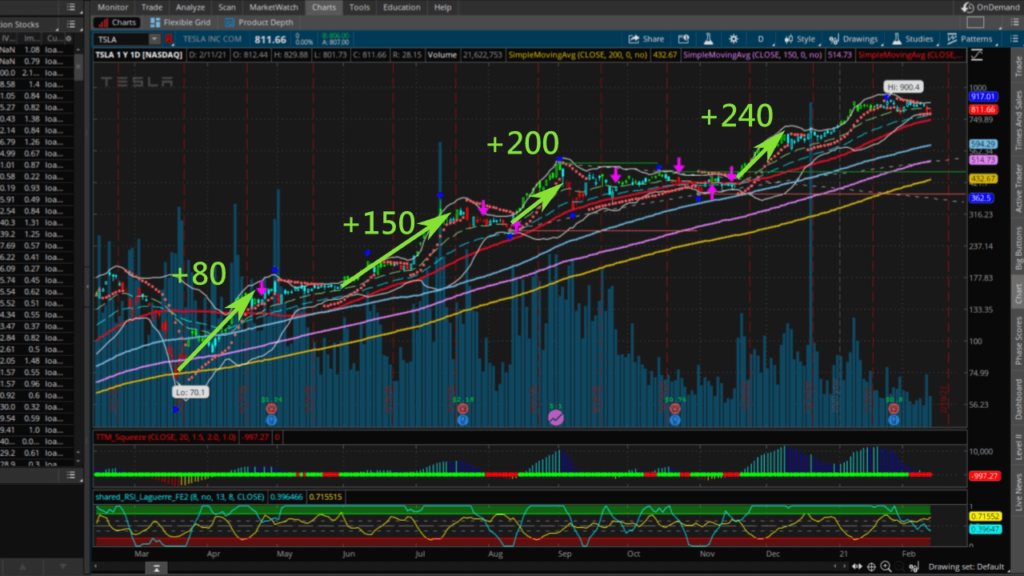
Warning Signs Before Tesla Stock Price Takes Off
Is there a pattern in how the Tesla price changes, and can we see signs that predict when the stock price goes up?
From the TSLA price trends last year, we can see 4 periods of exciting up trends, in which the stock price would increase by $100-200 in a very short time.
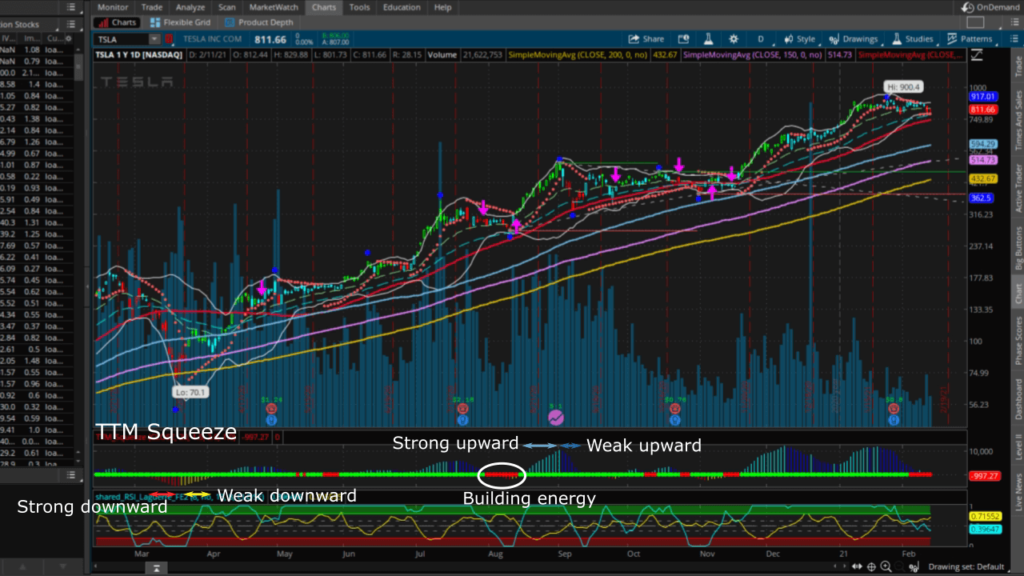
If we use TD Ameritrade's analytic tool, TTM Squeeze, we can see the same patterns which predicted the rise in 3 out of 4 occasions.
What Is TTM Squeeze?
TTM Squeeze compares the current stock price changes with the history data and plots the movement momentum with a multicoloured bar chart:
- Light blue indicates strong upward momentum
- Dark blue indicates weak upward momentum
- Red bar indicates strong downward momentum
- Yellow bar indicates weak downward momentum
- Red dots mean energy is being built up, and will be released in either strong bullish or bearish price moves
By referencing TTM Squeeze with the stock chart of TSLA, we can see 3 times out of the last 4 bullish spikes happened immediately after the red dots.
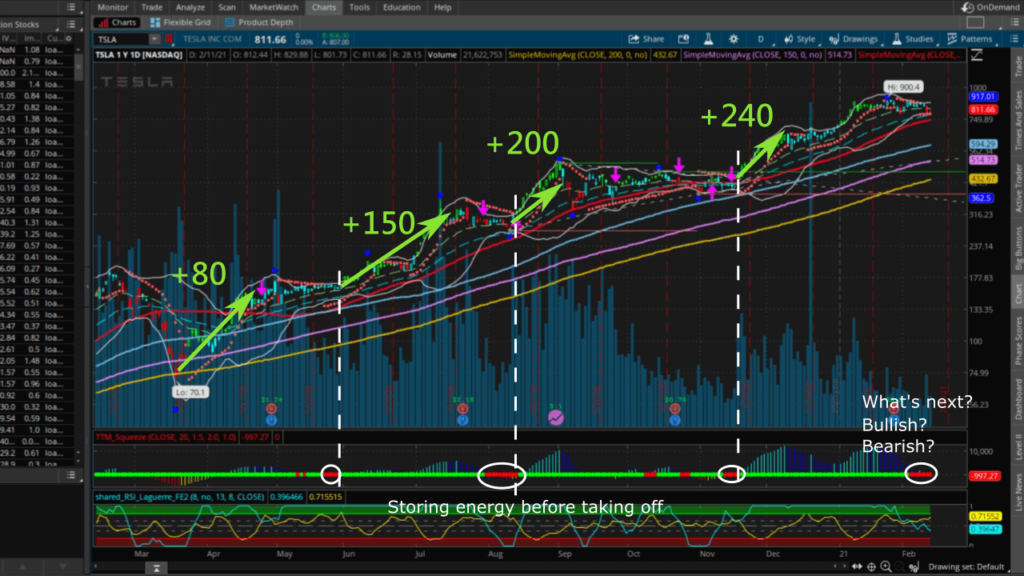
We also notice the red dots happened when the Bollinger Bands were narrowest, which means the options were the cheapest due to low IV. They were good opportunites to buy Call options to anticipate strong bullish moves.
We can see a few red dots are beginning to build up in the TTM Squeeze chart, so we expect either a strong bullish or bearish move very soon.

How to Increase Leverage Without Increasing Risk
If you believe TSLA will go up soon, we can just buy and hold Tesla stocks. But at the current price of $800, you only get Return on Capital of 25% if TSLA reaches $1000.
If we trade options, there is a chance to increase ROC to beyond 100%.
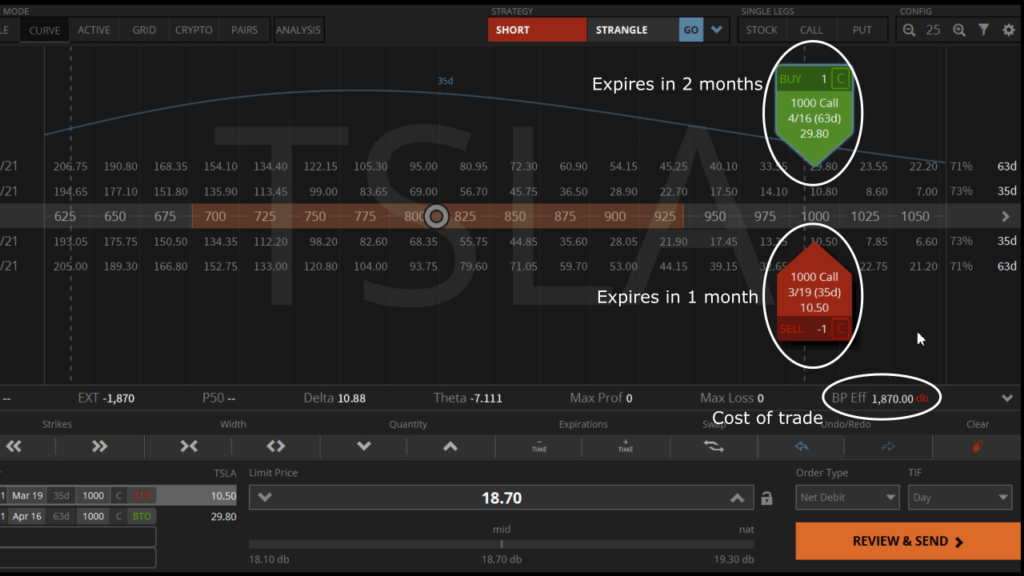
We can purchase a Calendar Spread to increase the leverage:
- Sell a Call option at $1000 that expires in a month
- Buy a Call option at $1000 that expires in 2 months
This strategy would require $1900 in Buying Power.
Purchase a Calendar Spread Using TD Ameritrade
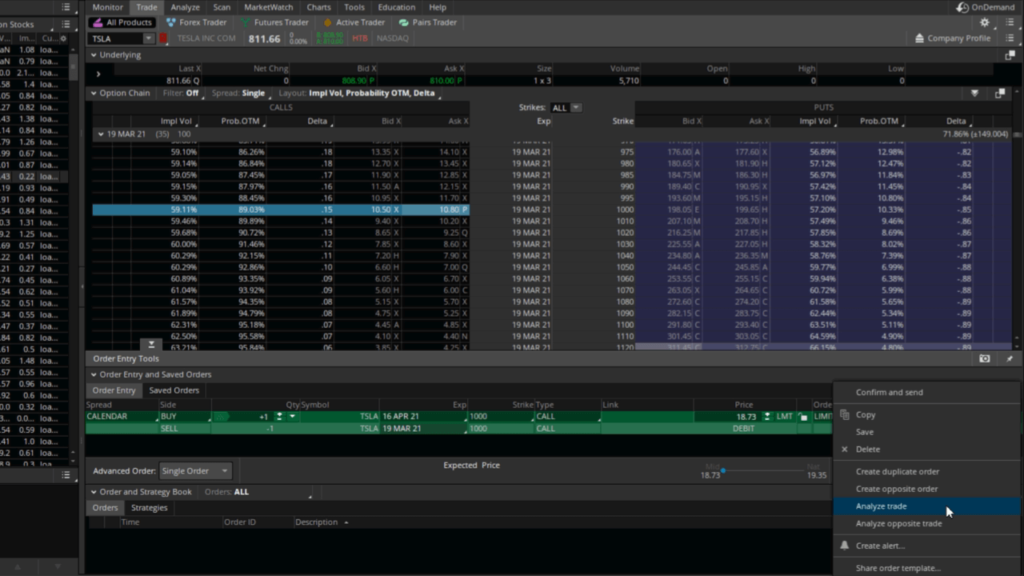
On the TD Ameritrade platform, go into the Trade tab, and BUY a Calendar at $1000 in the the next month's options.
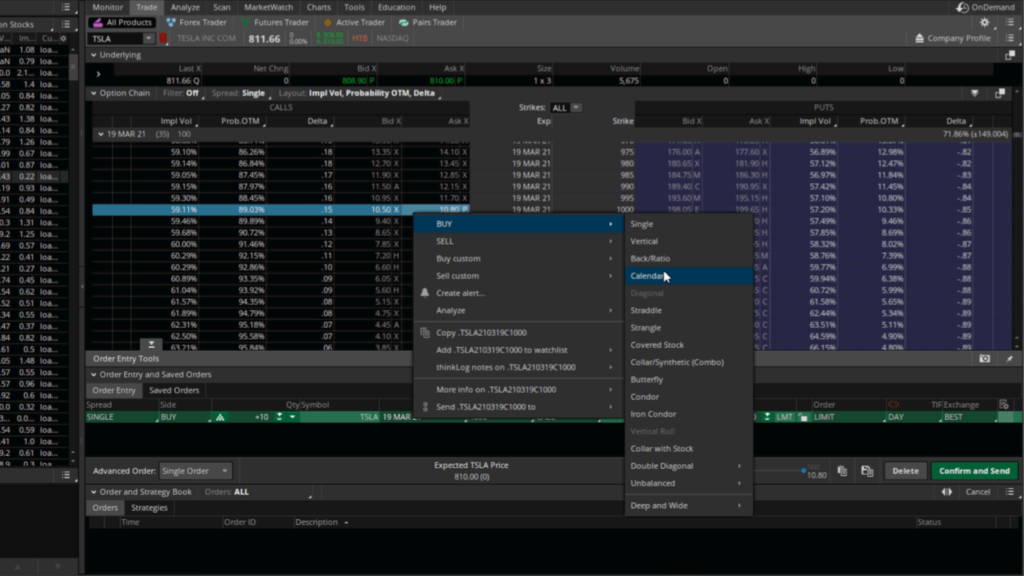
Adjust Qty to 1, and make sure you SELL a Call that expires in a month, and BUY a Call that expires in 2 months.
In the Risk Profile tab, we can see the Return on Capital is the highest when TSLA reaches $1000, when the value of the Call options in the Calendar Spread becomes $5000.
From a cost of $1900 to enter the trade, this represents a maximum ROC that is 160%.
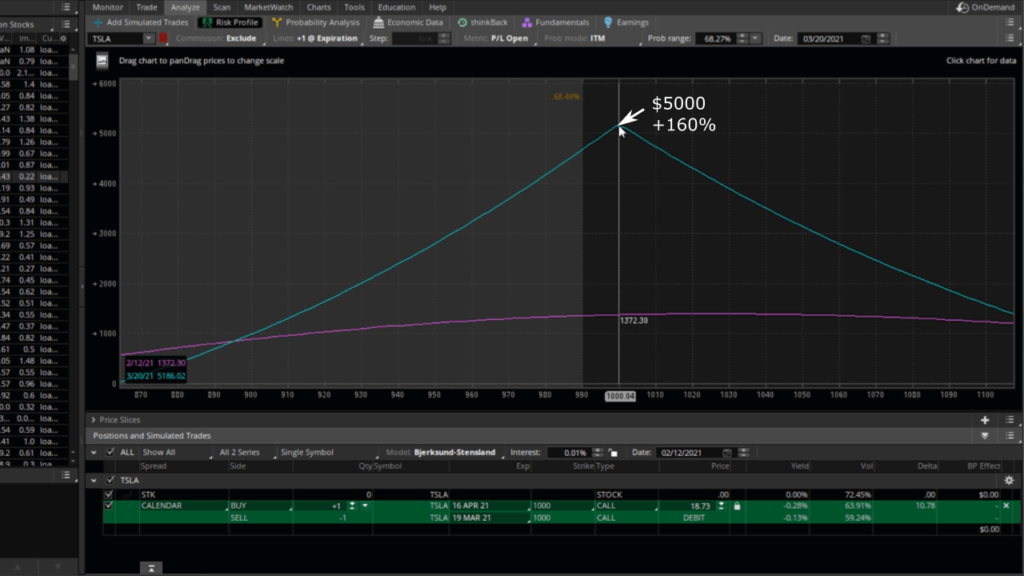
If we expect TSLA to go up to $1000, even though the cost to buy stocks is lower, the potential return is only 25%.
Though it costs $1900 to trade the Calendar Spread, the maximum ROC can be 160%, far greater than trading stocks.
| Strategies | Market direction | Minimum buying power | Return on capital |
|---|---|---|---|
| Stocks | Rise to $1000 | $800 | 25% |
| Calendar Spread | Rise to $1000 | $1,900 | 160% |
Subscribe to our membership to access all the unique stock scanners and receive real-time trade alert emails.
Trending Articles
- What Are Options Contracts and How Do They Work?
- Options Wheel Strategy to 3x Your S&P 500 ETF Return
- 3 Things We Hate About Selling Covered Calls
- Know Your Market Volatility, a Complete Guide to HV and IV
- Complete Guide to Delta Hedging to Protect Your Portfolio
- How to Roll Options to Repair Losing Trades


Can’t wait to test the ttm squeeze study to find channel breakout stocks
Wow, ttm squeeze seems like a pretty useful tool to find channel breakouts!
You’re absolutely right
謝謝介紹ttm squeeze這麼特別的交易指標
我也要試試看如何預測暴衝時機
TTM Squeeze可以預測接下來股價是否會暴衝或暴漲
不過需要結合基本面分析才能更精準預測是上漲或下跌