
Do you know it's possible to predict a market crash through stock chart analysis?
Today SlashTraders will use Tesla stock as an example to show the 3 common bearish signals, so you can react to bearish trends easily.
Contents
How Do You Know a Stock Is Overvalued?
We can use Trefis to help us determine a stock's fair value. If we use TD Ameritrade's Analyse tab to look at TSLA's Fundamentals, we can see Trefis estimates Tesla to worth $391 per share.
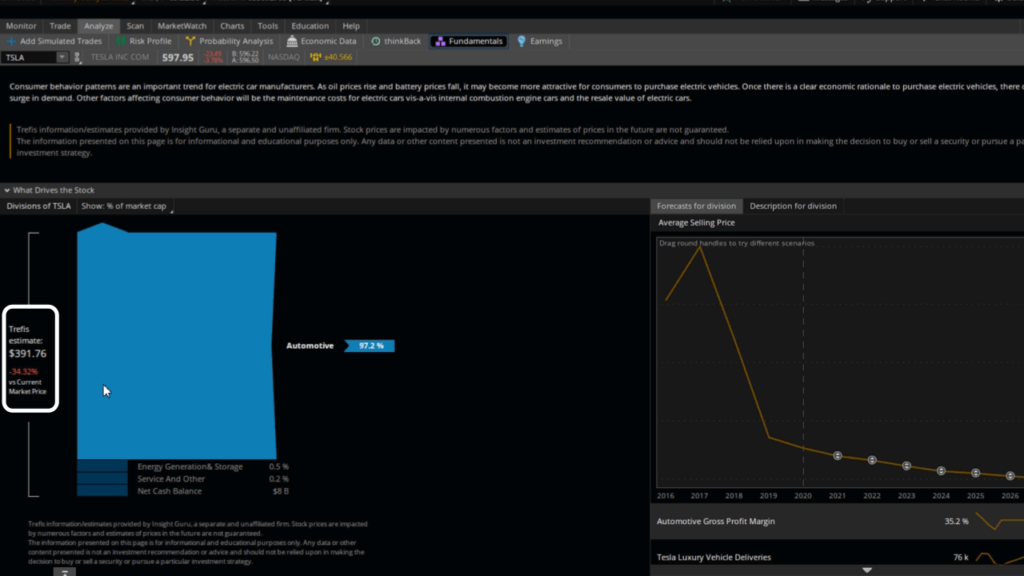
We can read the TD Ameritrade chart to find the intervals where the stock price exceeded $390.
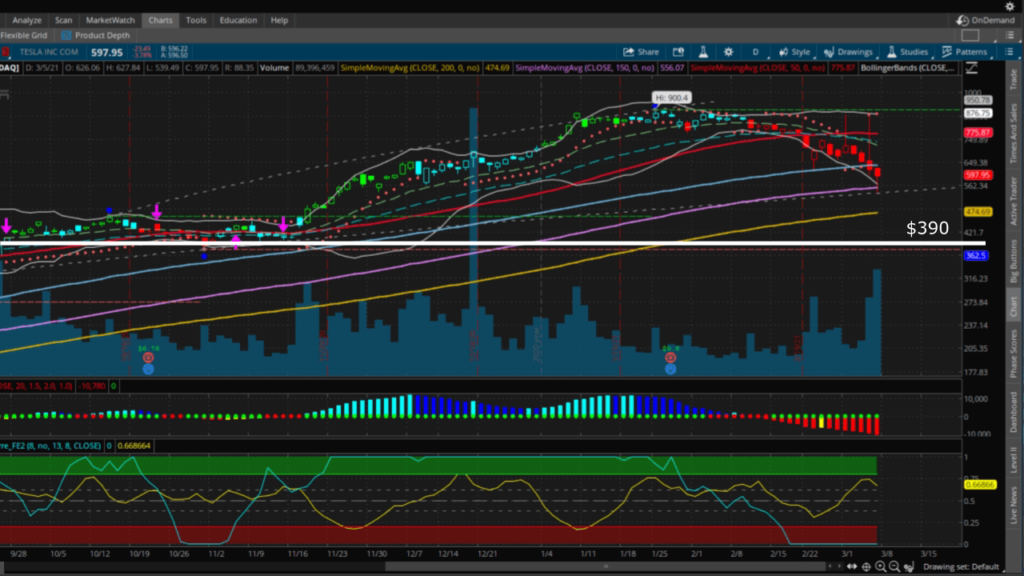
Now we know when TSLA is overvalued, we have the first bearish signal.
Use Bollinger Bands to Find Over Extended Prices
Bollinger Bands uses historical price data to model the statistical probability of future stock prices in a normal distribution. Its +/-2 standard deviation is a good reference to estimate the Implied Volatility to the stock.
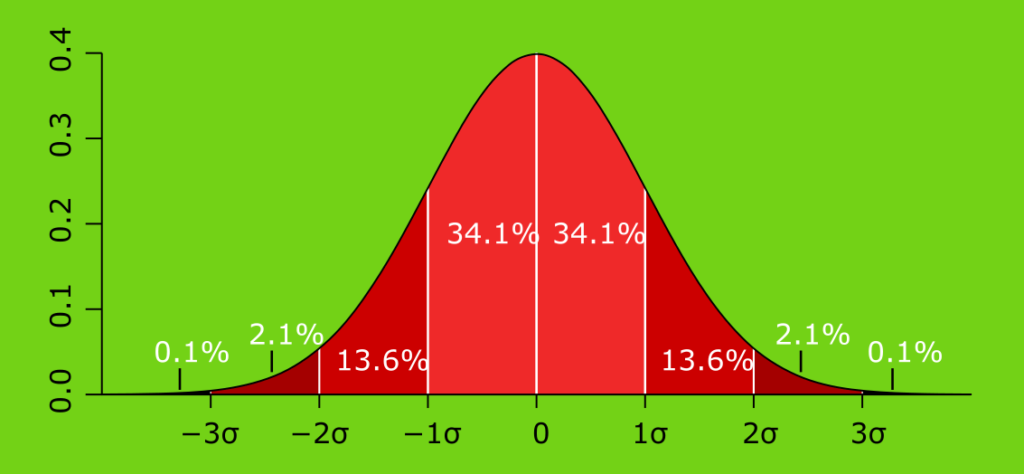
There is only a 5% chance that a sample will occur outside +/-2 standard deviation (σ).
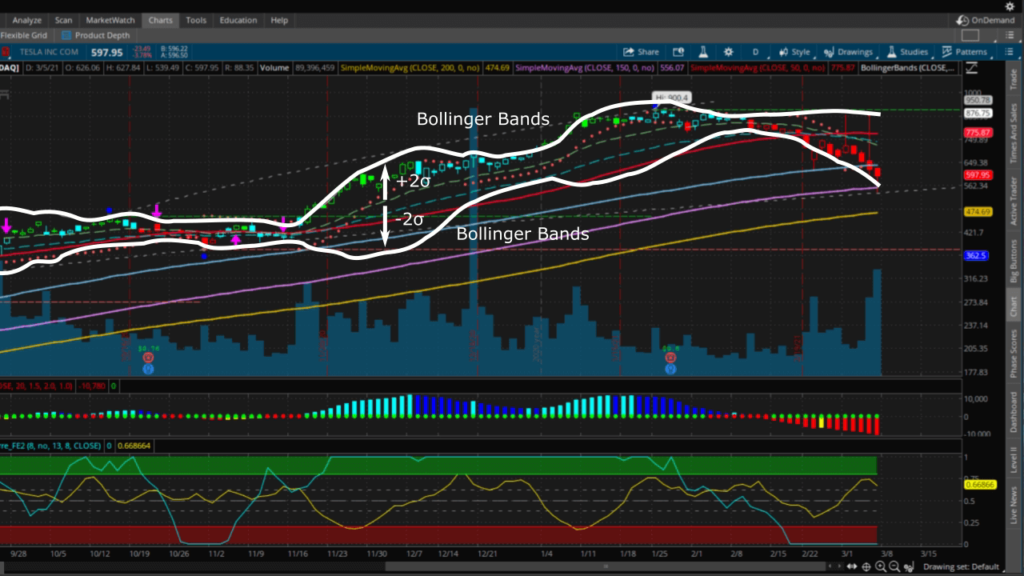
When TSLA stock price exceeds the upper Bollinger Band, we can say the price has overextended, and there is a high probability that the price will correct downwards.
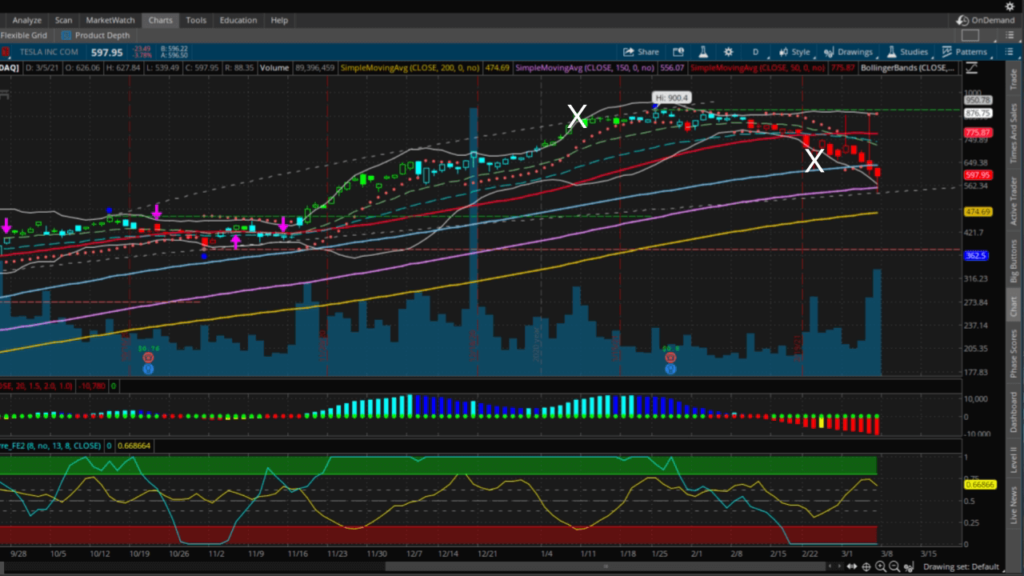
TSLA price moved beyond the Bollinger Bands a few times in the past year. If the price penetrated the Bollinger Bands in a upward move, there would be a high probability a downward correction would follow.

Use RSI to Find the End of Overbought Conditions
RSI compares historical data with current price movements to determine whether the stock is in Overbought or Oversold conditions.
When RSI exceeds 70, the stock is Overbought and will likely continue to rise; while RSI is below 30, the stock is Oversold and will likely continue to fall.
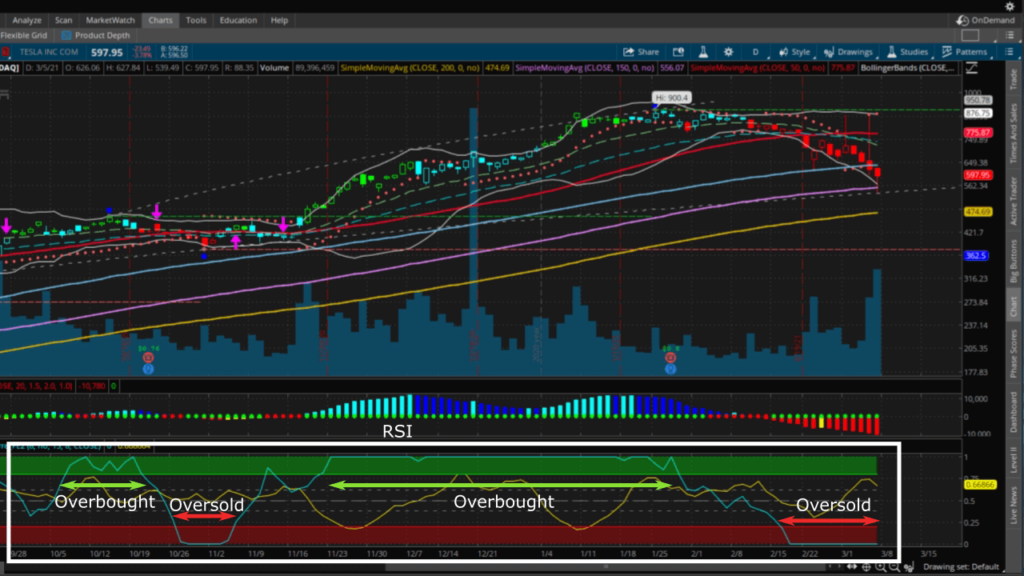
If the stock price stays Overbought for extended periods of time, we expect the stock price to fall after exiting Overbought conditions.
The RSI analysis of Tesla price fluctuations shows TSLA were Overbought for long periods in the last year. When Overbought ends, there is a high chance the stock will fall next.
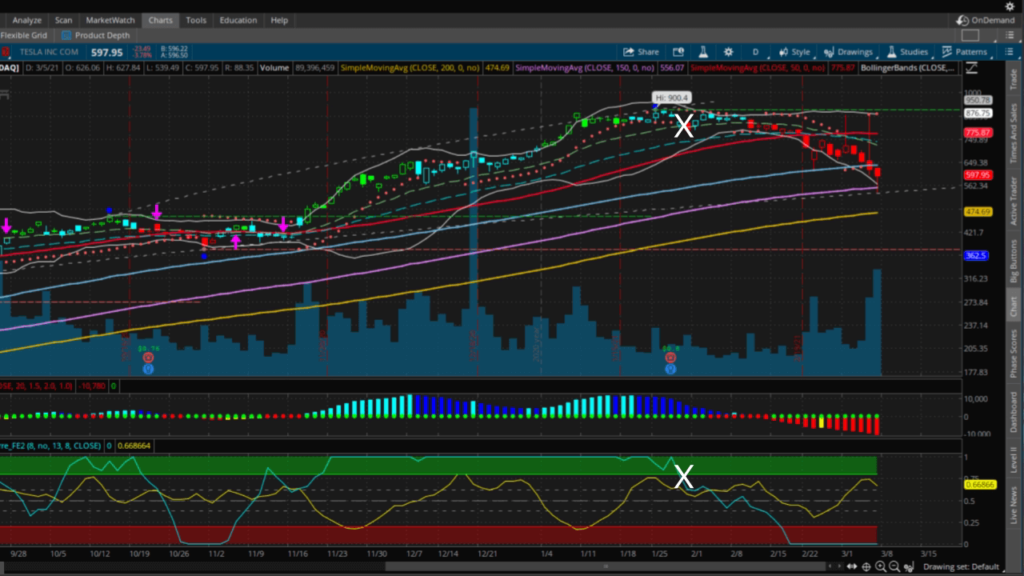
Now we know the 3 common bearish signals, we can use them to estimate when the stock price will fall. In our experience, when at least 2 signals appear at the same time, there is a huge probability the stock price will crash next.
If we overlay the 3 bearish signals together, we can see TSLA satisfied at least 2 bearish signals in both the start and end of January.
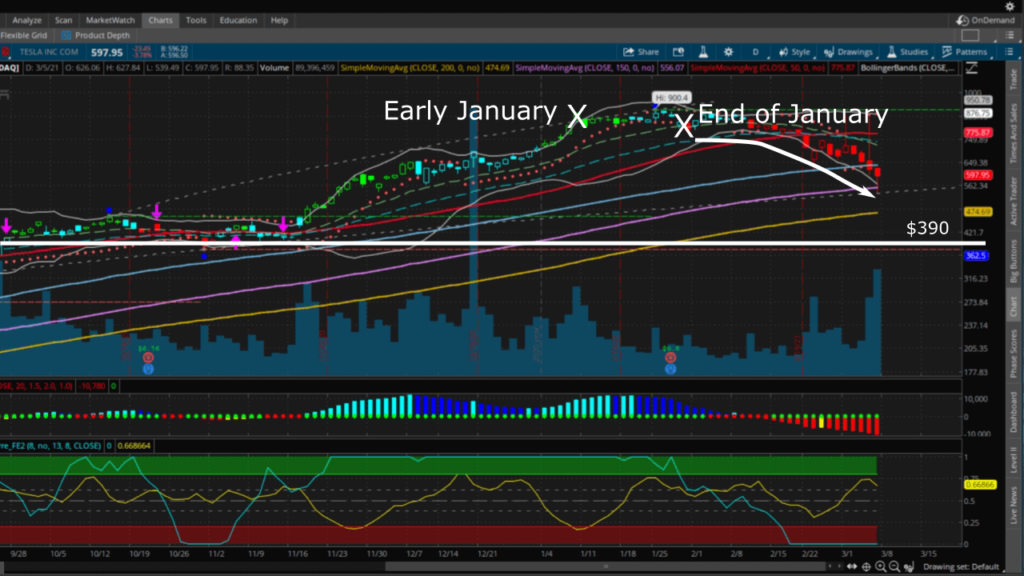
As expected, Tesla stock price fell in a big way after the end of January.
Take Advantage of the Down Trend by Selling Call At the Resistance
Since we can use bearish signals to forecast a price drop, we can sell a Call option at the resistance to be profitable from a bearish trend.
Since TSLA's last high point was $900, that could be the resistance to a future price correction.
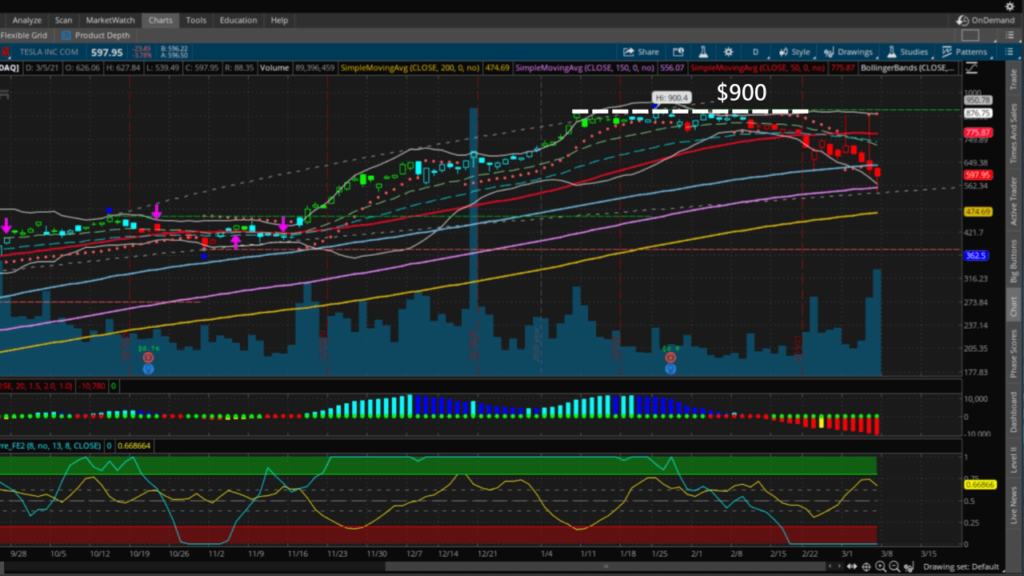
We can take advantage of the end of Overbought in early February to sell a Call option at $900.
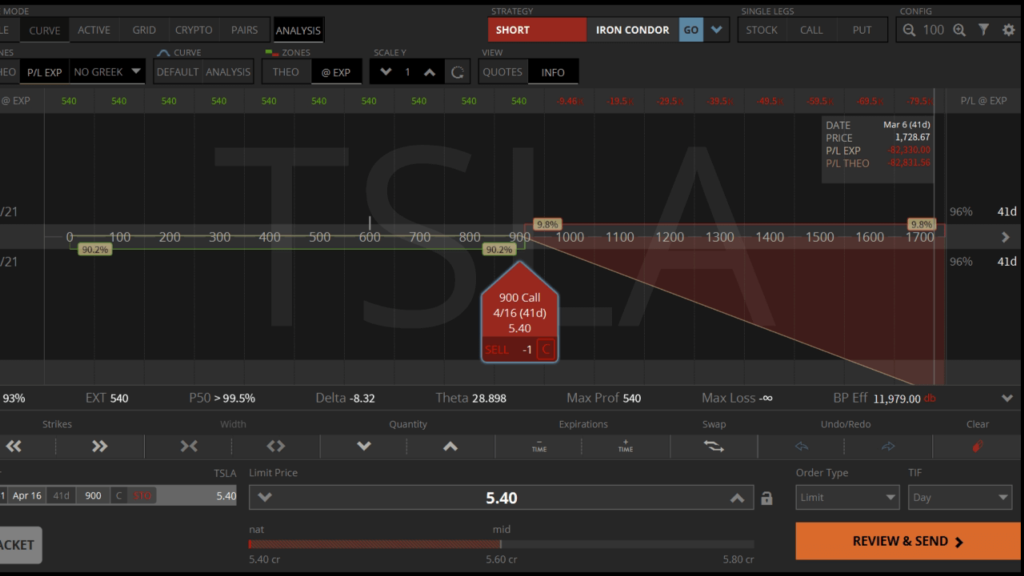
If the TSLA price does not rise above $900 before the Call expires, we will collect the full premium of the trade.
High Probability Bearish Trades Right Now
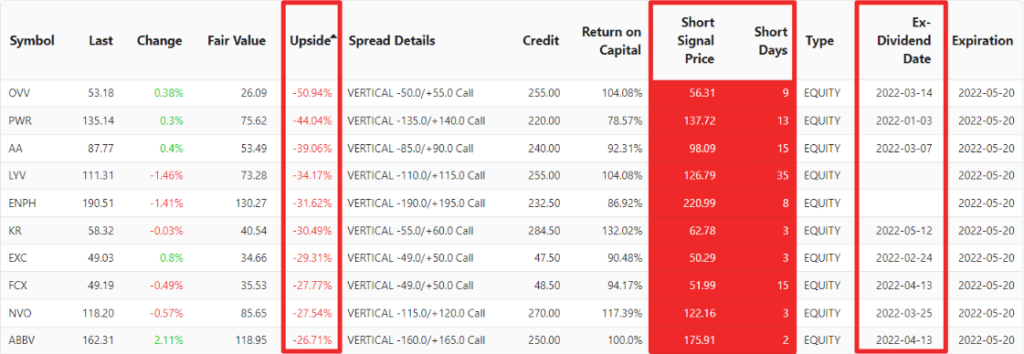
The Bear Call Spread Screener uses chart analysis to find overvalued stocks with a high probability of a downward correction that we can sell Bear Call Spreads to open.
We want to find heavily overvalued underlying that have a high probability of going down.
- The options screener uses fundamental analysis to calculate the Fair Value of the underlying then compare that with the Last value to find the potential Upside of the stock. When the Upside is less than -30%, we have high confidence in a bearish outlook.
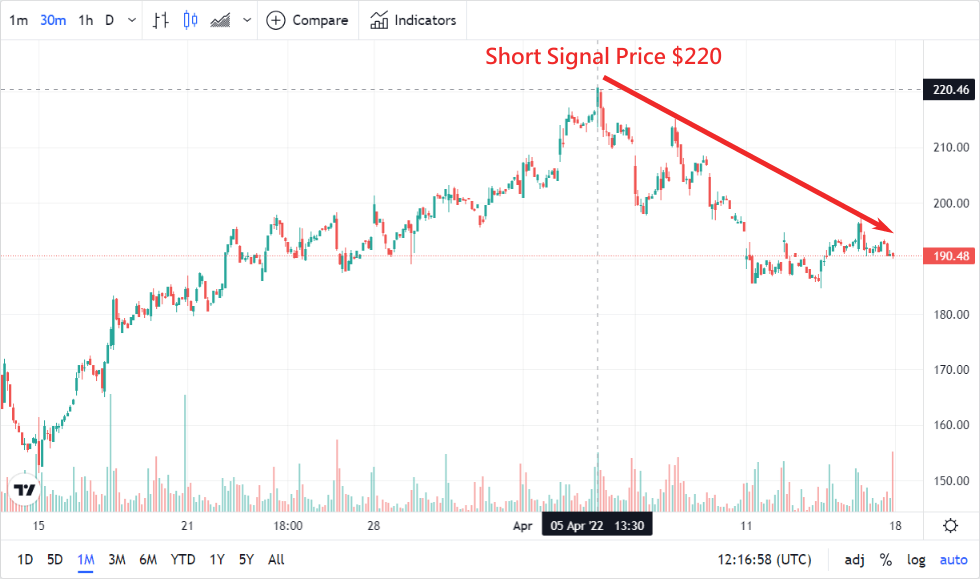
- Short Signal Price shows the topped out price from our technical analysis. So we know the stock price will not rise beyond this price in the short term.
- Short Days indicate the number of trading days has passed since the last short signal. As soon as the short signal appears, there is a high probability of a bearish move.
- We also need to avoid Ex-Dividend Date before options expiration. On one hand Ex-Dividend Date usually lead to rising prices and assignment. On the other hand, if you get assigned, you might need to pay dividends for shorting the stock.
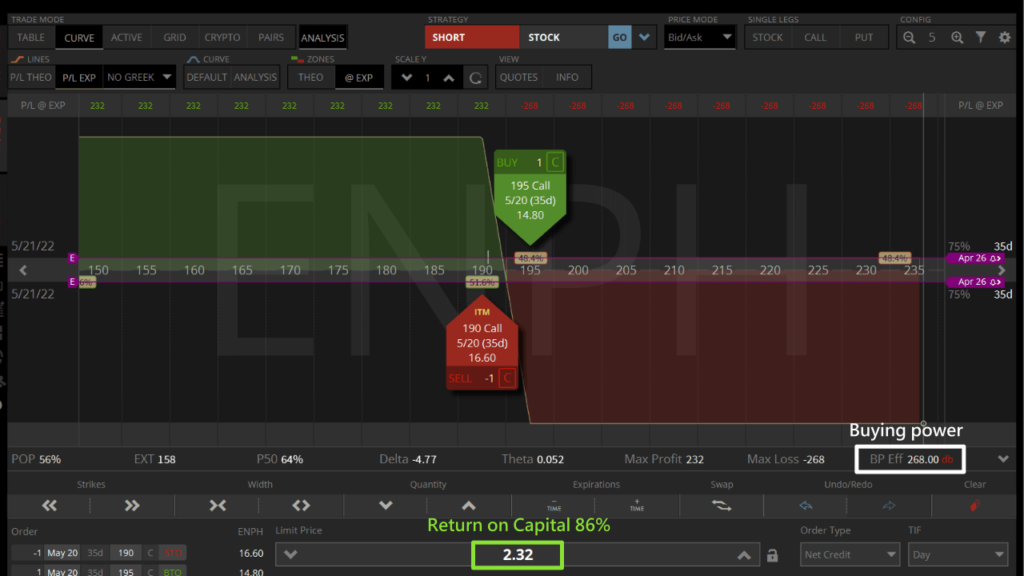
Since we are strongly bearish about our trade, we can use -0.50 delta ATM Bear Call Spread to calculate Return on Capital. This gives us the highest return when we are right, and the lowest maximum loss if we are wrong.
So we can look at the screener for the best ATM Bear Call Spread ideas.
By combining Upside and Short Days, we see ENPH is one of the most overvalued stocks, and has a short signal 8 trading days ago. It doesn't have an Ex-Dividend Date coming up. So it has a high probability of a bearish trend.
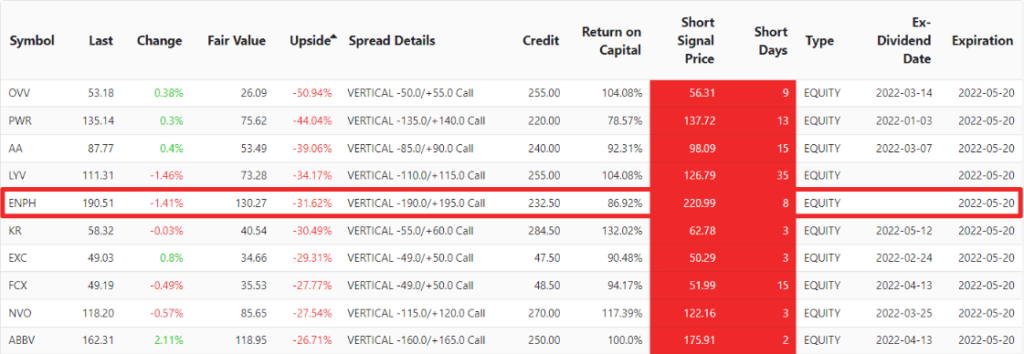
By checking the Enphase price trends, we confirm ENPH reached a high point at $220, similar to the Short Signal Price in our Bear Call Spread list, 8 trading days ago, and has been bearish ever since. We expect ENPH to stay below Short Signal Price in the short term.
We can sell an ENPH ATM Call Spread option that expires in 35 days. If the ENPH stock price does not rise before expiration, we have the potential to profit 86% from the trade.
Now it's your turn to experiment with the tactics we shared today, and look for overvalued stocks to profit with a Call option.
Subscribe to our membership to access all the unique stock scanners and receive real-time trade alert emails.
Trending Articles
- What Are Options Contracts and How Do They Work?
- 3 Things We Hate About Selling Covered Calls
- How to Buy Apple Stocks at a Discount When AAPL Is Overvalued
- Know Your Market Volatility, a Complete Guide to HV and IV
- Learn the Options Value Basics So You Can Buy Low Sell High
- Trade Poor Man’s Covered Call if You Can’t Afford 100 Stocks